Fig. 3
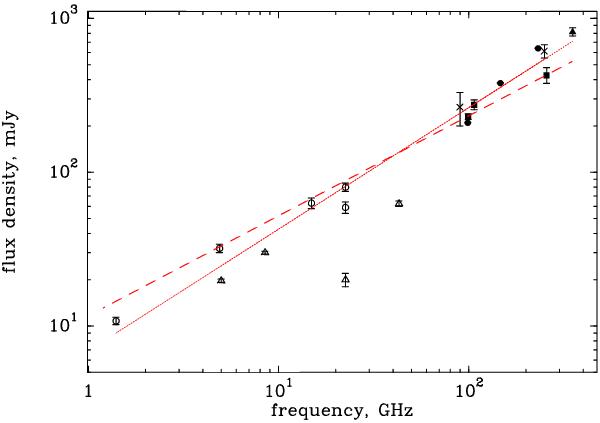
Spectral energy distribution of LkHα 101 in the radio/millimeter regime. Data are taken from Becker & White (1988) (°); Gibb & Hoare (2007) (△); Altenhoff et al. (1994) (×); Sandell et al. (2011) (▴); priv. comm. by Krips (•); and this paper (■). The continuous red line is a weighted fit to the observations and has a slope of α = 0.86 in logarithmic units. The dashed red line is a fit to the same data, where the slope has been fixed to its canonical value α = 0.60.
Current usage metrics show cumulative count of Article Views (full-text article views including HTML views, PDF and ePub downloads, according to the available data) and Abstracts Views on Vision4Press platform.
Data correspond to usage on the plateform after 2015. The current usage metrics is available 48-96 hours after online publication and is updated daily on week days.
Initial download of the metrics may take a while.