Fig. 2
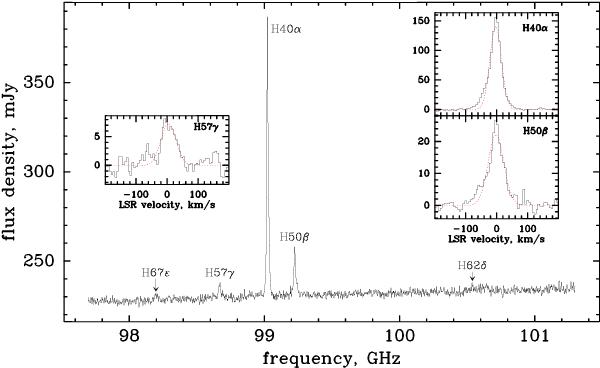
Interferometer spectrum obtained with the new wideband correlator (WIDEX) that is centered at 99.5 GHz. The five recombination lines that fall in the 3.6 GHz wide spectrum are labeled. The zoomed-in spectra of the three clearly detected lines are shown in the insets on velocity scales with the continuum subtracted. The dotted red curves indicate Gaussian fits whose parameters are listed in Table 2.
Current usage metrics show cumulative count of Article Views (full-text article views including HTML views, PDF and ePub downloads, according to the available data) and Abstracts Views on Vision4Press platform.
Data correspond to usage on the plateform after 2015. The current usage metrics is available 48-96 hours after online publication and is updated daily on week days.
Initial download of the metrics may take a while.