| Issue |
A&A
Volume 556, August 2013
|
|
|---|---|---|
| Article Number | A54 | |
| Number of page(s) | 21 | |
| Section | Extragalactic astronomy | |
| DOI | https://doi.org/10.1051/0004-6361/201220733 | |
| Published online | 24 July 2013 | |
HERschel Observations of Edge-on Spirals (HEROES)⋆
I. Far-infrared morphology and dust mass determination
1
Sterrenkundig Observatorium, Universiteit Gent,
Krijgslaan 281,
9000
Gent,
Belgium
e-mail: This email address is being protected from spambots. You need JavaScript enabled to view it.
2
School of Physics and Astronomy, Cardiff University,
Queens Buildings, The Parade,
Cardiff
CF24 3AA,
UK
3
INAF − Osservatorio Astrofisico di Arcetri, Largo E. Fermi
5, 50125
Florence,
Italy
4
Instituut voor Sterrenkunde, K. U. Leuven, Celestijnenlaan
200D, 3000
Leuven,
Belgium
5
Vakgroep Fysica en Sterrenkunde, Vrije Universiteit
Brussel, Pleinlaan
2, 1050
Brussels,
Belgium
6
Space Telescope Science Institute, 3700 San Martin Drive, Baltimore, MD
21218,
USA
7
European Space Agency, ESTEC, Keplerlaan 1,
2200 AG
Noordwijk, The
Netherlands
8
Institute for Astronomy, Astrophysics, Space Applications
& Remote Sensing, National Observatory of Athens, P. Penteli
15236
Athens,
Greece
Received: 14 November 2012
Accepted: 9 May 2013
Abstract
Context. Edge-on spiral galaxies with prominent dust lanes provide us with an excellent opportunity to study the distribution and properties of the dust within them. The HEROES project was set up to observe a sample of seven large edge-on galaxies across various wavelengths for this investigation.
Aims. Within this first paper, we present the Herschel observations and perform a qualitative and quantitative analysis on them, and we derive some global properties of the far infrared and submillimetre emission.
Methods. We determine horizontal and vertical profiles from the Herschel observations of the galaxies in the sample and describe the morphology. Modified black-body fits to the global fluxes, measured using aperture photometry, result in dust temperatures and dust masses. The latter values are compared to those that are derived from radiative transfer models taken from the literature.
Results. On the whole, our Herschel flux measurements agree well with archival values. We find that the exponential horizontal dust distribution model often used in the literature generally provides a good description of the observed horizontal profiles. Three out of the seven galaxies show signatures of extended vertical emission at 100 and 160 μm at the 5σ level, but in two of these it is probably due to deviations from an exactly edge-on orientation. Only for NGC 4013, a galaxy in which vertically extended dust has already been detected in optical images, we can detect vertically extended dust, and the derived scaleheight agrees with the value estimated through radiative transfer modelling. Our analysis hints at a correlation between the dust scaleheight and its degree of clumpiness, which we infer from the difference between the dust masses as calculated from modelling of optical data and from fitting the spectral energy distribution of Herschel datapoints.
Key words: galaxies: structure / infrared: ISM / infrared: galaxies / submillimeter: ISM / submillimeter: galaxies / dust, extinction
Herschel is an ESA space observatory with science instruments provided by European-led Principal Investigator consortia and with important participation from NASA.
© ESO, 2013
1. Introduction
In the past three decades, interstellar dust has changed from being mainly a nuisance that hampered any correct interpretation of optical data to a fascinating and important component of the interstellar medium in galaxies. Indeed, dust grains not only absorb and scatter light in the optical and ultraviolet (UV), but they also help regulate the physics and chemistry of the interstellar medium and play a crucial role in star and planet formation. Unfortunately, it is observationally hard to determine the amount, spatial distribution and physical properties of the interstellar dust in galaxies. The most straightforward way to trace the dust in galaxies is by looking at far-infrared (FIR) and submillimetre (sub-mm) wavelengths, where the emission by cold dust grains dominates the spectral energy distribution (SED). Until recently, the sensitivity, spatial resolution and wavelength coverage of the available FIR/sub-mm instrumentation has been rather limited, and most of our knowledge was often restricted to studying the global SED of galaxies (e.g. Soifer et al. 1987; Dunne et al. 2000; Pérez García & Rodríguez Espinosa 2001; Tuffs et al. 2002; Draine et al. 2007). This situation has changed substantially with the launch of the Herschel Space Observatory (Pilbratt et al. 2010), which has a much improved spatial resolution and wider wavelength coverage than any of its predecessors. With Herschel, we can now take spatially resolved FIR/sub-mm images to map the distribution of cool dust (the bulk of the dusty ISM) in nearby galaxies (e.g. Smith et al. 2010, 2012; Bendo et al. 2010, 2012; Pohlen et al. 2010; Kennicutt et al. 2011; Foyle et al. 2012; Fritz et al. 2012; Boquien et al. 2012; Xilouris et al. 2012; Aniano et al. 2012; Mentuch Cooper et al. 2012; De Looze et al. 2012c).
Edge-on spiral galaxies offer an interesting perspective for studying the dust properties and distribution in spiral discs. The dust in edge-on spiral galaxies often shows up as prominent dust lanes in optical images, which makes this class of galaxies among the only systems where dust can easily be studied both in extinction and in emission. They are also the only systems where the vertical distribution of the dust can be studied. Due to line-of-sight projection, edge-on spirals also allow us to map the horizontal distribution of dust in detail, since the increased surface brightness enables us to trace the dust extinction and emission to large radial distances from the centre. Cold dust has been located in substantial quantities at large galactocentric radii for a small number of edge-on spirals using FIR and sub-mm observations before (e.g. Alton et al. 1998; Dupac et al. 2003; Popescu & Tuffs 2003), but the limited sensitivity of the FIR instruments of the previous generation was a strong constraint on attempts to study the horizontal dust distribution for a larger sample of edge-on spiral galaxies.
The strongest constraints on the distribution and properties of dust in spiral galaxies can be achieved by studying the dust energy balance through a self-consistent treatment of extinction and thermal emission. Due to their special orientation with respect to us, edge-on spiral galaxies are the ideal targets for such energy balance studies. Several edge-on spiral galaxies have undergone dust distribution modelling by fitting realistic radiative transfer models to optical images (Kylafis & Bahcall 1987; Xilouris et al. 1997, 1998, 1999; Alton et al. 2004; Bianchi 2007; Baes et al. 2010; De Looze et al. 2012a). These studies suggest that, at least for massive galaxies, the dust is distributed in a disc that is vertically thinner but horizontally more extended (by some 50% on average) compared to the stellar disc. The face-on optical depths found are typically smaller than one at optical wavelengths, indicating that the entire galaxy disc would be almost transparent when seen face-on. This result is somewhat in contradiction to the spiral disc transparency measurements using either the number of background galaxies (Holwerda et al. 2005a, 2007b) or overlapping galaxy pairs (Domingue et al. 2000; Keel & White 2001a,b; Holwerda et al. 2009, 2013). These studies find that spiral arms are opaque and discs gradually become optically thick towards the galaxy’s centre.
The earlier results (Domingue et al. 2000; Holwerda et al. 2005b, 2007a) however sampled the disc in a large physical aperture (>1 kpc) which introduces a bias against transparent regions, as they were often placed by eye or include a spiral arm. Subsequent studies used the high resolution of Hubble Space Telescope to map the transparency of a large section of the disc. When the spatial resolution is sampling below the size of a typical molecular cloud, the distribution of the disc transparency becomes an exponential one with a 0.3−0.5 drop-off depending on the Hubble Type and mass of the galaxy (Holwerda et al. 2009). With the inclusion of a size distribution of ISM clouds in SED models and more measurements of the distribution of disc transparency using occulting galaxy pairs, the two approaches are set to converge on a physical model of light transport in spiral discs.
A quantitative comparison of these spiral galaxy radiative transfer models based on optical extinction with FIR/sub-mm emission observations leads to an interesting discrepancy: the rather optically thin dust discs determined from the optical modelling absorb about 10% of the stellar radiation, whereas the FIR/sub-mm observations of normal spiral galaxies indicate they typically reprocess about 30% of the UV and optical radiation (Popescu & Tuffs 2002; Davies et al. 2012). This dust energy balance problem is particularly evident when studying individual edge-on spiral galaxies: self-consistent radiative transfer models which successfully explain the optical extinction, predict FIR/sub-mm fluxes that underestimate the observed values by a factor of about three (Popescu et al. 2000; Misiriotis et al. 2001; Alton et al. 2004; Dasyra et al. 2005; Baes et al. 2010; De Looze et al. 2012a). To solve this energy budget problem, two widely different scenarios have been suggested. One straightforward solution proposed is that the FIR/sub-mm dust emissivity has been underestimated significantly (Alton et al. 2004; Dasyra et al. 2005). The other scenario seeks the solution in the geometrical distribution of stars and dust, which is impossible to disentangle precisely in edge-on galaxies. If a sizeable fraction of the FIR/sub-mm emission arises from dust having a negligible influence on the extinction of the bulk of the starlight, e.g. because it is locked up in compact clumps, it can produce relatively more FIR/sub-mm emission compared to a galaxy with stars and dust smoothly mixed (Popescu et al. 2000; Misiriotis et al. 2001; Bianchi 2008).
As indicated earlier, Herschel offers the possibility to study the dust emission from spiral galaxies in more detail than ever before. The combination of the sensitivity and the wavelength coverage of the Photodetector Array Camera and Spectrometer (PACS, Poglitsch et al. 2010) and Spectral and Photometric Imaging Receiver (SPIRE, Griffin et al. 2010) instruments, which together cover the 70 to 500 μm wavelength region where the emission from cold dust dominates, enables us to make reliable estimates of the total thermal emission of the interstellar dust. The increase in spatial resolution compared to previous FIR instrumentation is a huge advantage: while energy balance studies in the past almost exclusively relied on integrated SEDs, Herschel observations allow us to trace both the vertical and horizontal distribution of FIR/sub-mm emission in detail and make the comparison with spatially resolved radiative transfer model predictions. Studies exploiting PACS and SPIRE observations of edge-on galaxies have already demonstrated that a further leap forward in the comprehension of dust distribution and characteristics is now possible (Baes et al. 2010; Bianchi & Xilouris 2011; Holwerda et al. 2012b; De Looze et al. 2012a,b).
This paper is the first in a series devoted to the HERschel Observations of Edge-on Spirals (HEROES) project. The goal of the HEROES project is to make a detailed study of the amount, spatial distribution and properties of the interstellar dust in a sample of seven large, edge-on spiral galaxies, and to link this to the distribution and properties of stars, interstellar gas and dark matter. This project builds strongly on new Herschel observations, which are crucial for a solid determination of the distribution of cold interstellar dust. However, we have also set up a multi-wavelength observational campaign to map the different components in these systems, including optical, near-infrared, Hi and CO observations. Moreover, we will analyse and interpret the observational data using state-of-the-art radiative transfer simulations.
Properties of the galaxies in our sample.
In this first HEROES paper, we concentrate on a presentation and a qualitative and quantitative analysis of the Herschel data. This work will be followed up by a number of papers which will focus on different aspects of this rich data set. In Paper II we will exploit the high spatial resolution of the Herschel images in conjunction with Spitzer and WISE data to derive the dust properties as a function of position, by adopting a pixel–by–pixel SED fitting approach in a similar fashion as done by Smith et al. (2010, 2012). In Paper III we will present existing and new optical and NIR images of the seven HEROES galaxies, and we will fit detailed radiative transfer models to these images. This study will take advantage of FitSKIRT (De Geyter et al. 2013), a fitting tool built around the SKIRT Monte Carlo radiative transfer code (Baes et al. 2003, 2011) designed to fully automatically recover the structural properties of dust and stars with a particular focus on edge-on systems. These models will be used to self-consistently predict the spatially resolved FIR/sub-mm emission from each of the galaxies in our sample, extending previous attempts to panchromatic models over the entire UV/optical/NIR range. In Paper IV we will combine the Herschel data with new and archival Hi and CO data in order to study the spatially resolved gas-to-dust ratio in edge-on spiral galaxies out to large radii.
The outline of the paper is as follows: in Sect. 2 we describe the sample selection and give details on the Herschel observations and data reduction. In Sect. 3 we derive the global fluxes for the galaxies in our sample at the PACS and SPIRE wavelengths, and we compare the values with archival fluxes at comparable wavelengths obtained with IRAS, ISO, Akari and Planck. In Sect. 4 we discuss the FIR/sub-mm morphology of the individual galaxies in detail, based on the Herschel maps and major axis profiles. In Sect. 5 we discuss the vertical distribution of the FIR/sub-mm emission and look for evidence of cool interstellar dust at high galactic latitudes. In Sect. 6 we apply a simple modified black-body fitting to the global fluxes to derive dust masses and temperatures, and we compare these dust masses with those obtained from radiative transfer fits to optical data. Finally, in Sect. 7 we present our conclusions.
2. Observations and data reduction
2.1. Sample selection
The HEROES sample consists of seven galaxies, which were selected from a large sample of edge-on spiral galaxies according to the following criteria. The first criterion is an optical diameter of at least 4, in order to have sufficient spatial resolution in the Herschel images, even at 500 μm (where the angular resolution is 36). The second criterion is somewhat more subjective: we require the galaxies to have a clear and regular dust lane. This requirement was driven by our ambition to construct detailed radiative transfer models of the observed galaxies, in order to compare the predicted FIR emission with the observations. This second requirement limits the sample to galaxies with an inclination that deviates at most a few degrees from exactly edge-on. Unfortunately, in the range so close to edge-on, galaxy inclinations cannot be easily determined in an objective way, for example based on axial ratios. This criterion also limits the sample to rather massive galaxies with rotational velocities vrot ≳ 120 km s, as less massive galaxies tend not to show a dust lane even if their inclinations are almost perfectly edge-on (Dalcanton et al. 2004)1.
Based on these considerations, the starting point of our sample was the combination of the samples from Xilouris et al. (1997, 1999) and Bianchi (2007), since they were successful in fitting radiative transfer models to optical and NIR data with their respective codes. A number of the galaxies in this sample (NGC 4302, NGC 5746 and NGC 5965) showed evidence of irregular dust lanes and rendered modelling of the extinction very difficult to impossible, therefore they were omitted from the sample. The cut in optical diameter removed IC 1711 from the sample. Finally, the prototypical example of an edge-on galaxy, NGC 891, was omitted as it was slated to be observed by Herschel as part of the Very Nearby Galaxy Survey (VNGS) key programme.
The remaining seven edge-on spiral galaxies form the sample for the HEROES project (see Table 1 for the main properties). Distances were taken from NED according to the following criterion: if the galaxy has a redshift z > 0.01 (which is the case for NGC 973 and UGC 4277), we assume the Hubble flow contribution is dominant and adopt the redshift dependent distance based on the velocity with respect to the 3K CMB, using H0 = 73 km s Mpc; for all others we use the average value of the redshift independent distance measurements, which are mostly based on the Tully-Fisher relation. The position angles listed in Table 1 were either taken from Bianchi (2007), or determined from the PACS 100 μm images.
2.2. Herschel observations
All galaxies were observed with PACS and SPIRE separately, both with their nominal scan speed, i.e. 20/s for PACS and 30/s for SPIRE. Map sizes vary between 8′ × 8′ and 16′ × 16′ and have been chosen to cover enough surrounding sky area to characterise the background. For the PACS maps, four cross-scans (i.e. four nominal and four orthogonal scans) were performed, while the SPIRE maps were observed with a single cross-scan.
Full details on all Herschel observations carried out can be found in Table 2.
Details of the Herschel observations.
2.3. Data reduction
For the PACS data reduction, the Herschel interactive processing environment (HIPE, Ott 2010) v8.0 with PACS calibration version 32 was used to bring the raw data to Level-1, which means flagging of pixels, flat-field correction, conversion to Jansky and assigning sky coordinates to each detector array pixel. These intermediate timelines were then fed into Scanamorphos v15, an IDL program which is capable of removing the 1/f noise, drifts and glitches by using the redundancy in the observational data and in the end produces the resulting maps (Roussel 2013). The pixel sizes in the final maps are the default values used in Scanamorphos, i.e. 1 70 and 285 for the 100 μm and 160 μm maps respectively. These pixel sizes correspond to one quarter of the point spread function (PSF) full width at half maximum (FWHM) for the scan speed used in our observations, which has values of 68 and 114 at 100 and 160 μm respectively (PACS Observer’s Manual 2011). In producing the final maps, a customised sky grid was used to project the major axes horizontally.
To process the SPIRE data up to Level-1, which was done using HIPE v8.0, the official pipeline was modified into a custom script, applying the latest calibration products (calibration tree v8.1). Instead of applying the default temperature drift correction and median baseline subtraction, we used a custom method called BriGAdE (Smith et al., in prep.) to correct for the temperature drifts. The final SPIRE maps were produced with the naive mapper, using pixel sizes of 6, 8 and 12 for the 250 μm, 350 μm and 500 μm maps respectively. These sizes were chosen to measure about a third of the SPIRE beams’ FWHM, having values of 182, 245 and 360 respectively (SPIRE Observer’s Manual 2011). As was the case for the PACS maps, the final SPIRE maps were projected onto a sky grid with a horizontal major axis.
Due to some internal calibration adjustments on the satellite, observations performed during operational day (OD) between 320 and 761 might suffer from pointing accuracy issues, and may not always be trustable. All of our observations, apart from those for NGC 973, could then be affected by potential astrometry issues. We have taken this into account in the data reduction by using the pointing product supplied by the HSC2.
2.4. Optical images
V-band images used for this work are a combination of both data already available in the literature and new observations. UGC 4277, NGC 5529, NGC 4013 and NGC 4217 are from Bianchi (2008, see Sect. 2 of that paper for a detailed presentation of these data). Data for IC 2531 are taken from Xilouris et al. (1999, a detailed description is given in their Sect. 2). Finally, data for NGC 5907 and NGC 973 are from newly performed observations at the Telescopio Nazionale Galileo (TNG). Both galaxies were observed in 5 exposures of 150 s between August and October 2011, with a seeing of about  . As NGC 973 is located close to a bright star, causing severe reflection effects on the first observations, it was re-observed with a rotated field of view to avoid the bright star. NGC 5907 is larger than the TNG-DOLORES field of view, so that two different observations had to be combined.
Optical images are shown here (see Figs. 2 to 8) mainly for illustrative purposes, as they will be exploited in future works in the frame of the HEROES project.
Global PACS and SPIRE fluxes and the major and minor semi-axes of the used elliptical apertures for the galaxies in the sample.
3. Global fluxes
We determined the global flux of the seven HEROES galaxies in the two PACS and three SPIRE bands using aperture photometry. We adopted the same approach as described in Dale et al. (2012) for the flux determination, background subtraction, and uncertainties calculation. To derive the total fluxes we defined, for each galaxy, an elliptical aperture, roughly centred on the galaxy itself. For each galaxy, the size of the aperture is defined in such a way that it encompasses all the emission at 500 μm, as this band has the poorest spatial resolution. No aperture corrections were applied to the measured fluxes. In any case, using the image at the poorest resolution to define the ellipses within which fluxes are calculated should ensure that no flux is lost. As a further check, we performed flux measurements on the 500 μm images by choosing various apertures at increasingly higher a and b (major and minor axis of the ellipses, respectively) values. The results make us confident that even at the longest wavelength we are not missing any significant fraction of the extended emission.
The lengths of the major and minor semi-axes are reported in Table 3 for each galaxy. We then used the DS9/Funtools program Functs, which sums the flux value of each pixel inside the aperture, to yield the global flux. Sky subtraction is performed as follows: we define a number of circular apertures surrounding the galaxy, far enough so that they are not contaminated by its emission, but as close as possible to the galaxy in order to better sample the sky properties of its surroundings, also making sure they do not include any background source. A mean sky level per pixel is then computed from these apertures and this value, multiplied by the number of pixels encompassing the galaxy within the elliptical aperture, is subtracted from the global flux measured as explained before.
A colour correction factor is included, taken from the ICC “PACS Photometer − Colour Corrections” document3 and from the “SPIRE Observer’s Manual”4, respectively. For PACS, we used the tabulated values relative to a modified black body with a temperature of 20 K and emissivity index β = 2, which are both well suited for the SEDs of our objects (see Sect. 6.2; values relative to T = 15 K were adopted for UGC 4277 as its best fit model favours a lower temperature). As for SPIRE, we used colour correction values calculated for extended sources, with an index αS = 4 (which turned out to be the most appropriate choice of β = 1.8). A calibration correction factor was also applied to account for the fact that our sources are extended (see SPIRE Observer’s Manual, Sect. 5.2.8).
As for the uncertainties, we calculate the total uncertainty by summing in quadrature the calibrations uncertainty (5 and 7% for PACS and for SPIRE, respectively5) and the uncertainty on the sky level, which we compute as in Eq. (2) in Dale et al. (2012).
As a check on the accuracy of the derived flux densities (fluxes are reported in Table 3), we searched in the literature and various archives for other flux densities at similar wavelengths. For all galaxies but IC 2531, IRAS flux densities are available at 100 μm (Moshir et al. 1990; Sanders et al. 2003; Lisenfeld et al. 2007). All galaxies except NGC 973 and UGC 4277 were detected by Planck in the Early Release Compact Source Catalog (Planck Collaboration 2011). The two brightest galaxies in our sample, NGC 5907 and NGC 4217, were detected by ISO as part of the ISOPHOT 170 μm Serendipity Survey (Stickel et al. 2004). Finally, four galaxies (NGC 973, NGC 4217, NGC 5529 and NGC 5907) are listed in the Akari/FIS All-Sky Survey Point Source Catalogue (Yamamura et al. 2010).
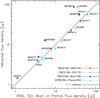 |
Fig. 1 Comparison between the PACS 100 μm, PACS 160 μm and SPIRE 350 μm fluxes with IRAS, ISO, Akari and Planck fluxes. |
Figure 1 shows the comparison of the PACS 100 μm, PACS 160 μm and SPIRE 350 μm fluxes of the HEROES galaxies with the IRAS 100 μm, Akari 160 μm, ISO 170 μm and Planck 857 GHz fluxes respectively. The solid line in the plot shows the one-to-one relationship. The agreement between the Herschel fluxes and the archival IRAS, ISO and Planck (aperture) fluxes is generally excellent. The only exception is NGC 5907, where the PACS 100 and 160 μm fluxes deviate significantly from the IRAS 100 μm and ISOPHOT 170 μm fluxes respectively: 57.35 versus 37.43 Jy at 100 μm and 88.56 versus 35.83 Jy at 160/170 μm. A possible explanation is the large extent of this galaxy, which is resolved even by the 2.94 IRAS 100 μm beam (Soifer et al. 1989). The SPIRE 350 μm flux (25.83 ± 1.98 Jy) and Planck 857 GHz flux (27.25 ± 0.69 Jy) of NGC 5907 are in excellent agreement.
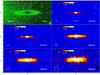 |
Fig. 2 Optical V-band and Herschel PACS and SPIRE images for NGC 973. The image sizes are about 6′ × 3′. The orientation and angular scale are given in the top right panel. The band for each panel is shown in its bottom right corner, with the Herschel beam size indicated by the circle in its bottom left corner. |
While the agreement between IRAS, ISO and Planck on the one hand, and Herschel on the other hand is very good, Fig. 1 shows that the agreement between the PACS 160 μm flux densities and the Akari/FIS 160 μm flux densities is very poor. The PACS fluxes are on average a factor two higher than the Akari fluxes. This difference is probably due to the way Akari fluxes are measured, i.e. similarly to PSF fitting. While the PSF of Akari is about 60′′ at 160 μm, all the galaxies in our sample are much larger, so it is indeed expected that the latter are smaller than the Herschel fluxes.
4. FIR/sub-mm morphology
In this section we describe the FIR morphology of the observed galaxies, based on the PACS and SPIRE maps presented in Figs. 2 through 8. We also produce horizontal profiles of the FIR/sub-mm emission in each of the Herschel bands, which we present in Fig. 9. These profiles were derived by integrating the flux over the image pixels along strips parallel to the minor axis and averaging through division by the number of pixels used for each strip. The area used for this procedure was a rectangle centred on the galaxy, having sizes equal to the major and minor axes of the elliptical apertures used in the flux determination (Table 3). These profiles are hence a sort of average surface brightness profiles along the horizontal direction. We used these collapsed profiles instead of straight cuts along the major axis to increase the signal-to-noise.
We compare the observed profiles to the theoretical horizontal one expected from the so-called double-exponential model, described by the three-dimensional density distribution 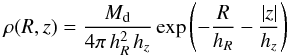 (1)with R and z the horizontal and vertical position within the system’s coordinates, Md the total dust mass, and hR and hz the dust’s horizontal scalelength and vertical scaleheight, respectively. This model is the most commonly adopted description of the three-dimensional distribution of dust in spiral galaxies (e.g. Xilouris et al. 1997, 1998, 1999; Alton et al. 2004; Bianchi 2007, 2008; Popescu et al. 2011). If this system is perfectly edge-on, with the major axis aligned to the x-axis, it has a mass surface density distribution which is described by the following:
 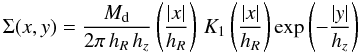 (2)where K1 is the modified Bessel function of the first order (see e.g. Kregel et al. 2002, Eq. (2)). When we collapse this surface density distribution in the vertical direction and normalise the resulting expression, we find as horizontal profile:
 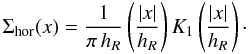 (3)In Fig. 9 we also show these exponential models with scalelengths determined from modelling of optical data taken from the literature (see Table 5), represented with black crosses. However, it should be pointed out that these models only describe the dust distribution, while the actual data profiles from the Herschel maps show instead the characteristics of the dust emission, such as its temperature. For most galaxies in our sample, the 500 μm profiles follow this exponential model to a reasonable degree, although even this model is incomplete: it fails to include the truncation of the dust disc. Vertical profiles were derived in a similar fashion; these are presented in Fig. 10 and discussed in Sect. 5.
Information such as distances, optical radius, morphological and spectral types are taken from the NASA Extragalactic Database (NED).
4.1. NGC 973 [UGC 2048]
NGC 973 is located at a distance of 63.5 Mpc and has a D25 diameter of 4 03. Its morphological class is estimated to be Sb or Sbc, due to the inherent uncertainty of the precise structure of edge-on galaxies, and it is classified as a Seyfert 2/LINER galaxy. The inclination is found to be
  (Xilouris et al. 1997) and the galaxy is showing a prominent dust lane (Guthrie 1992) over its entire span, from the centre to the edges. Although Pildis et al. (1994) claimed not to have found any extraplanar emission-line gas in Hα, Miller & Veilleux (2003) did detect some extraplanar emission from gas, but also mentioned there is no suggestion of a widespread diffuse emission above the disc plane. It is assumed the dust shows the same or at least similar behaviour. A previous attempt to model the dust distribution was presented in Xilouris et al. (1997), resulting in a dust scalelength of 50 or 16.3 kpc, about 50% longer than the equivalent stellar disc scalelength.
The different wavelength maps, horizontal and vertical profiles for NGC 973 are shown in Figs. 2, 9 and 10 respectively. This galaxy demonstrates a very peculiar behaviour in its horizontal profiles compared to the other galaxies in the sample. For one thing, the surface brightness shows a relatively shallow decline, out to about 14 on the SW side and about 14 to 16 – depending on the wavelength – on the NE side of the disc and then falls down dramatically, suggesting a possible truncation of the dust disc. In addition to this, the emission shows a very sharp and strong central peak at PACS wavelengths, which has almost completely vanished from 350 μm onwards, partly because of the poorer spatial resolution at these latter wavebands. This strong peak is overshadowing the other secondary peaks visible at PACS wavelengths on either side (at roughly 075 and – to a lesser extent – 12 from the centre).
The central peak clearly visible in both the 100 and 160 μm horizontal profiles might be linked to the fact that this galaxy hosts an active galactic nucleus, which would then be responsible for the compact, warmer emission in the innermost regions. We checked whether this peak is compatible with a point-like emission, as expected – at these resolutions – for an AGN-like source. To do so, we convolved a set of Gaussians with the 1-dimensional PSF profile derived from the PACS PSF (Aniano et al. 2011), and subtracted them from the horizontal profile derived at 100 μm, the highest resolution data. We found that the central peak is compatible with a Gaussian profile emission with an upper limit on the central source’s FWHM of , corresponding to a physical scale of ~450 pc. Due to the low spatial resolution at SPIRE wavelengths it is very difficult to draw any further conclusions about the disc structure.
4.2. UGC 4277
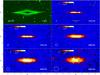 |
Fig. 3 Optical V-band and Herschel PACS and SPIRE images for UGC 4277. The image sizes are about 6′ × 3′. |
UGC 4277 is the most distant galaxy in our sample at a distance of 76.5 Mpc, with a D25 diameter of 39 and a classification as an Sc or Scd type galaxy. It has an inclination of  (Bianchi 2007), with a clear dust lane visible from the centre to the edges. Modelling of the dust distribution has been previously carried out in Bianchi (2007), giving a dust scalelength of 35 or 12.5 kpc, which is about the same as the fitted stellar disc scalelength.
The horizontal profiles for UGC 4277 – maps are given in Fig. 3 – show a rather erratic behaviour. At 100 μm, a number of small peaks are visible, but none of these can be pinned down as the central one. On top of that, a smaller secondary peak about 13 off centre toward the east end of the galaxy is almost separated from the rest of the disc by a clear drop in emission at this wavelength and emission levels fall sharply just beyond this peak, while on the other side, the profile gets dominated by the background somewhere around 15 away from the centre. The other PACS wavelength is more symmetrical, with one central peak and one secondary about 05 off centre on either side – though all three have roughly the same strength – and the profile drops off very steeply beyond these secondaries, but first levels out at a reduced plateau before falling off farther beyond 13 on both sides. At SPIRE wavelengths, the surface brightness seems to be smoother, maintaining a plateau up to 04 to 05 from the centre before declining down to the background at about 16 off centre.
An exponential distribution for the dust turns out to be a fairly good representation of the observed horizontal profiles at SPIRE wavelengths while PACS profiles are characterised by a more irregular behaviour. The only clearly distinguishable feature in the maps is a concentration of the surface brightness on one side of the centre at 100 μm, rendering the structure of the dust disc hard to determine.
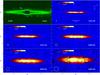 |
Fig. 4 Optical V-band and Herschel PACS and SPIRE images for IC 2531. The image sizes are about 6′ × 3′. |
4.3. IC 2531
IC 2531 is the only galaxy on the southern hemisphere in our sample. It is located at a distance of 36.8 Mpc and it has a D25 diameter of 75. It is classified either as an Sb or as an Sc type galaxy showing Hii regions, and it is characterised by a conspicuous peanut-shaped or boxy bulge (Jarvis 1986; de Souza & Dos Anjos 1987). With a fitted inclination of  (Xilouris et al. 1999), this galaxy is oriented almost perfectly edge-on. The dust lane is very prominent and regular, and extends from the galactic centre to the edge of the disc, as well as into the higher stellar layers, which is evidenced by dust features traceable up to a few scaleheights (de Grijs & Peletier 2000). Many attempts have been made to determine the dust distribution from fitting extinction models to the dust lane by several works including Wainscoat et al. (1989), Just et al. (1996), Kuchinski et al. (1998) and Xilouris et al. (1999), but only the latter performed a global fit. According to the model by Xilouris et al. (1999), which includes both absorption and scattering, the dust in IC 2531 has a horizontally extended distribution with a scalelength of 75 or 13.7 kpc, about 50% larger than the fitted stellar scalelength.
The maps for IC 2531 are shown in Fig. 4. Apart from the one at 500 μm, all horizontal profiles show a plateau with a primary central peak and clear secondary peaks symmetrically positioned around the centre at a distance of roughly 1, beyond which point they drop off sharply, out to about 2 to 25 from the centre, where they are no longer distinguishable from the background. Possibly due to the lower resolution, the surface brightness at 500 μm remains almost flat from the centre out to about 15 on either side, where it starts to drop off, though not as sharp as in the other bands.
Because of the clear secondary peaks, especially the 100 μm map indicates a possible ring-like or spiral structure, along with a more diffuse dust disc, although this could simply be the continuation of the same structure seen edge-on. It is also not clear whether this is a single structure or possibly two or more concentric rings – as indicated by the slight revival of the 100 μm emission at about 15 on either side of the centre.
4.4. NGC 4013
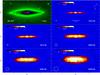 |
Fig. 5 Optical V-band and Herschel PACS and SPIRE images for NGC 4013. The image sizes are about 6′ × 3′. |
At a distance of 18.6 Mpc, NGC 4013 has a D25 diameter of 52, is variously classified as an Sbc (Xilouris et al. 1999), an Sb or an SAb type galaxy with Hii regions and is considered a LINER galaxy. Furthermore, the galaxy possesses a box-shaped bulge (Jarvis 1986; de Souza & Dos Anjos 1987) and shows a very clear warp in various bands but sometimes in opposite directions for the dust, gas and stellar component of the galaxy disc (Bottema et al. 1987; Sanchez-Saavedra et al. 1990; Florido et al. 1991; Bottema 1995, 1996), although Xilouris et al. (1999) claim the stellar distribution in their optical images has no warp significant enough to affect their model. The inclination angle estimates for this galaxy vary from  (Xilouris et al. 1999) to
  (Bianchi 2007). Apart from a bright foreground star blocking the view, the dust lane in this galaxy can be clearly traced from the centre out to the furthest edges as well as out of the central plane in optical images from Howk & Savage (1999), especially at larger radii where the bulge no longer dominates. Its dust distribution has been previously modelled with global fits to optical extinction data in Xilouris et al. (1999) and Bianchi (2007), resulting in dust scalelengths varying from 45 or 3.9 kpc (Xilouris et al. 1999) to 30 or 2.7 kpc (Bianchi 2007), corresponding to about 25% longer (Xilouris et al. 1999), respectively shorter (Bianchi 2007), than the stellar disc scalelength. Furthermore, Comerón et al. (2011) have found evidence of a substantial secondary thick disc and a third stellar vertically extended disc structure.
The different wavelength maps for NGC 4013 are presented in Fig. 5. The horizontal profiles show a very sharp central peak at 100 μm, as well as symmetrically located secondary peaks about 06 off centre, although the latter have a difference in strength, with the one at the NE end of the disc being slightly brighter. Both primary and secondary peaks stand out above a plateau level, which reaches out to about 06 to 1 either side of the centre, while the peaks seem to have evened out at 350 μm and beyond, most probably due to the coarser resolution. Beyond the plateau, the profiles become much steeper, up to about 13 to 2 from the centre, where the background begins to dominate.
The horizontal profile displays a substantial departure from the simple exponential model we superimposed to the data, at PACS wavelengths, due to the highly peaked emission, while it is more consistent at the longest wavelengths. The PACS maps are, in fact, largely dominated by the emission coming from the central region, possibly contaminated by some nuclear activity as its LINER classification hints at. Similarly as for NGC 973 (see Sect. 4.1), we determined an upper limit on the extent of the emitting region by convolving a set of Gaussians with the PACS PSF and subtracting them from the horizontal profile. For NGC 4013, we find an upper limit on the central source’s FWHM of  , corresponding to a physical scale of ~120 pc.
Apart from this prominent central peak, the emission from the disc seems to be concentrated in a single ring-like or spiral structure. This is much more difficult to discern in the SPIRE maps, due to the poorer resolution.
4.5. NGC 4217
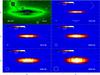 |
Fig. 6 Optical V-band and Herschel PACS and SPIRE images for NGC 4217. The image sizes are about 6′ × 3′. |
For NGC 4217, we assume a distance of 19.6 Mpc. The galaxy has a D25 diameter of 52 and is classified as an Sb or SAb sp type galaxy, showing Hii emission regions. Having an inclination of  (Bianchi 2007), the galaxy is displaying a dust lane, visible along the entire disc and with an extensive vertical dust distribution (Howk & Savage 1999; Thompson et al. 2004), although we note that Alton et al. (2000a) consider this galaxy to be too highly inclined to make any unambiguous claims about extraplanar dust. A global fit of extinction by the dust distribution to optical images was carried out in Bianchi (2007), giving a dust scalelength of 70 or 6.7 kpc, which is 75% larger than the stellar disc scalelength.
Compared to the other galaxies in the sample, the horizontal profiles for NGC 4217 are remarkably smooth: only the 100 μm profile – and the 160 μm one to a lesser extent – shows some small secondary peaks at 04 and 06 from the centre, and two more, less prominent, at 1 and 14, but all on the SW side. However, the overall behaviour is quite peculiar and differs between wavelengths. At 100 μm, the profile first drops off from the centre outward, until about 16 on the SW side and about 1 on the NE side of the disc. At these points, a break in behaviour occurs and the slope of the profile becomes much steeper, up to about 2 on either side, where the background takes over. For the other wavelengths, the profiles have a slightly different character: on the SW side of the disc, they run more or less parallel to the 100 μm profile until the break in slope at about the same position, but beyond this point they are not as steep as the 100 μm profile and reach out to about 25. On the other hand, at the NE end of the disc they seem to have a single slope out to 25.
The exponential model we superimposed to the observed horizontal profile seems to be a good representation of the data, especially in the innermost regions. The PACS 100 μm map shows two clearly visible secondary peaks, along with one (possibly two) fainter structure(s), but due to the fact that all these are located on just one side of the disc (the SW end), lacking any clearly distinguishable counterparts on the other side, it would be very hard to identify any of these as a ring or spiral arm with any degree of certainty. Due to the worsening angular resolution, these structures can no longer be told apart at the longer wavelengths.
4.6. NGC 5529
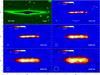 |
Fig. 7 Optical V-band and Herschel PACS and SPIRE images for NGC 5529. The image sizes are about 6′ × 3′. |
With a distance of 49.5 Mpc, NGC 5529 has a D25 diameter of 635 and is classified as an Sc type galaxy (Xilouris et al. 1999). The system shows a clear warp (Sanchez-Saavedra et al. 1990, in POSS Blue and Red) and a box-shaped bulge (de Souza & Dos Anjos 1987). The fitted inclination is  (Bianchi 2007), exposing a very prominent dust lane (de Grijs & van der Kruit 1996) along the major axis as well as in the vertical direction (de Grijs & van der Kruit 1996). The dust distribution was previously modelled in Xilouris et al. (1999) and Bianchi (2007) based on a global fit to optical extinction data, both determining a dust scalelength of 50, corresponding to 11.7 kpc (Bianchi 2007) or 11.9 kpc (Xilouris et al. 1999), which is about 35% (Bianchi 2007), respectively 50% (Xilouris et al. 1999), larger than their fitted stellar disc scalelength.
All PACS and the SPIRE 250 μm horizontal profiles have a clear central peak, along with two secondary peaks on the SE side at 08 and 15 from the centre and another secondary peak around 06 on the other side, the latter having a small plateau at PACS wavelengths. On the other hand, the other SPIRE horizontal profiles show no apparent central peak and only marginally differentiable peaks at the locations of the secondaries visible at the previous wavelengths. At SPIRE wavelengths, the emission in the central region remains more or less at a plateau out to around 15 on the SE side and to around 08 on the NW side, after which the profiles drop off rather sharply out to 2 on both sides, then reach another plateau at a reduced level, and finally fall steeply around 25 from the centre. For the PACS wavelengths, the profile behaviour is quite different: while the NW side can be interpreted as having a constant plateau underneath the secondary peak out to 08 from the centre, the SE side shows a shallow but clear slope out to about 16 from the centre. Beyond these edges, the PACS profiles drop off sharply out to about 2 on either side.
A single dust disc with an exponential distribution does not suffice to describe the FIR emission for this galaxy, as can be concluded from the horizontal profiles, mostly due to the central regions where the profiles are relatively flat. The mentioned secondary peaks can be clearly distinguished in the images up to 250 μm, but given their differing positions on either side of the central peak, one would tend to conclude it is more likely that it concerns a spiral structure rather than a few ring-like structures. A final remark on this galaxy is the possibility of a warp in the dust disc: at least at 100 μm, the outer secondary peaks (at 14 on the SE side and at 06 on the NW side) are collinear with the centre, but the brightest secondary peak (at 08 from the centre on the SE side of the disc) seems to be concentrated slightly to the SW side of the major axis. This could mean that this brightest secondary peak lies just outside the main dust disc, but perhaps a more likely possibility is that the whole dust disc has a position angle different from the adopted V-band value, with the 08 (SE) and 06 (NW) secondary peaks more or less collinear with the bulge, while the outer peak at 14 (SE) is warped outside of the dust disc. It should be pointed out that Bianchi (2007) notes a slight warp in the outer parts of the disc is clearly visible in the optical observations.
4.7. NGC 5907
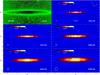 |
Fig. 8 Optical V-band and Herschel PACS and SPIRE images for NGC 5907. The image sizes are 10′ × 5′. |
The galaxy NGC 5907 is at a distance of 16.3 Mpc and has a D25 diameter of 1277. It is considered to be either an Sc (Xilouris et al. 1999) or an SA(s)c type galaxy and it has Hii regions. According to Sanchez-Saavedra et al. (1990, in POSS Blue and Red) it has a barely perceptible warp, but the stellar (Morrison et al. 1994) and Hi (Sancisi 1976; Shang et al. 1998) warps are definitely both bending in the same direction. Sandage & Bedke (1994a) claim the galaxy has a thin disc with the central bulge absent, but a bulge was fitted well with a modified Hubble profile by Barnaby & Thronson (1992), although resulting in a bulge-to-disc luminosity ratio of only 0.05 in the H-band. The inclination for the system has a fitted value of  (Xilouris et al. 1999). The dust lane extends from the centre out to the edges along the major axis, and although Howk & Savage (1999) state that the galaxy has no detectable vertically extended dust or ionised gas, Alton et al. (2000a) claim this galaxy to be insufficiently edge-on to make any definite statements about extraplanar dust. The dust distribution has been previously modelled using global fits to the dust lane extinction in optical images (Xilouris et al. 1999), leading to a dust scalelength of 100 or 7.8 kpc, which is about 10% larger than the corresponding stellar disc scalelength.
Up to 250 μm, the horizontal profiles display a number of clear secondary peaks on each side of the central peak, more or less symmetrically positioned. All but the 100 μm profile have roughly the same behaviour, with a single slope from the centre out to around 35 from the centre and then a steeper slope out to about 5 to 6 on either side, although the 500 μm profile shows a slightly shallower decline in the central area up to about 3 on both sides. The PACS 100 μm has a steeper drop-off beyond 2 from the centre out to around 4 on either side, where the background starts to dominate.
The exponential dust distribution is in this case a very good description of the FIR horizontal profiles, at least at SPIRE bands, also considering the disc is possibly truncated. The fact that there are several secondary peaks distinguishable at PACS wavelengths on either side of the centre, could be indicative that a spiral structure is more likely than a dust ring.
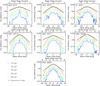 |
Fig. 9 Horizontal profiles for the galaxies in the sample, at Herschel wavelengths. An arbitrary offset was introduced between different wavelengths for the sake of visualisation. A corresponding profile resulting from the double-exponential model is overplotted with black crosses, to compare with the commonly adopted description of the spatial dust distribution. The profiles are oriented as in the maps. |
5. Vertical dust distribution
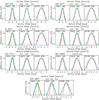 |
Fig. 10 Vertical, normalised, profiles at 100, 160 and 250 μm are plotted as green crosses, to which we superimpose, as a blue line, a fit with an exponential profile, convolved with the Herschel beam at the appropriate wavelength (depicted here as a red line). |
In this section, we discuss the vertical distribution of the FIR/sub-mm emission in the HEROES galaxies. As mentioned in the Introduction, edge-on spiral galaxies are the only systems where we can directly infer the vertical distribution of the dust. The presence of a spatially resolved vertical profile in the FIR for an edge-on galaxy might be related to dust above the galactic disc (extraplanar dust), ejected from the galactic plane. Whether such “dusty thick discs” are a common feature in spiral galaxies, and what the correlation is with other physical properties, is not yet well understood. Furthermore, studying the mechanisms that are responsible for dust ejection can shed new light on the transport of ISM from the galactic plane to higher latitudes.
Studying the vertical distribution of dust can be done in two ways: either by analysing the absorption in optical images, or by directly studying the vertical distribution of the FIR/sub-mm emission. Radiative transfer modelling efforts of optical images of edge-on spiral galaxies typically result in a dust disc with a vertical scaleheight that is approximately only half the vertical scaleheight of the stellar distribution, implying that the dust has a smaller vertical velocity dispersion than the stars. Deep optical imaging, however, has shown significant amounts of extraplanar dust in several edge-on spirals (e.g. Howk & Savage 1999; Alton et al. 2000b; Thompson et al. 2004). This dust at high latitudes can be interpreted as either expelled outflowing material from the galaxy if it is present, or infalling intergalactic matter otherwise (Howk 2009). Small dust grains and polycyclic aromatic hydrocarbons (PAHs), both relatively warm, have been traced in direct emission up to several kpc above the disc plane of some edge-on spirals (e.g. Irwin & Madden 2006; Irwin et al. 2007; Kamphuis et al. 2007; Whaley et al. 2009).
As already explained in Sect. 2.3, we have, first of all, reprojected all the images so that the major axes of the galaxies are parallel to the x axes of the maps (see Figs. 2 to 8). We subsequently extracted vertical profiles at PACS and SPIRE wavelengths for each galaxy. To do so, we first selected the area, along the horizontal extent, where any pristine emission from the galaxy could be securely detected. We then summed all the pixel values along the image x coordinate (along the major axis) and normalised the resulting profiles. The resulting vertical profiles are shown in Fig. 10.
We modelled these vertical profiles with an exponential function of the form: 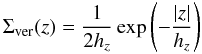 (4)as appropriate for an exactly edge-on, double-exponential disc (see Appendix A). Before fitting this vertical profile to the observed data, we first convolved it with the Herschel beams at the appropriate wavelength. The latter were obtained from the circularised PSF images described in Aniano et al. (2011). In order to obtain the one-dimensional beams, we averaged the two-dimensional PSFs along one direction, adopting a similar procedure as that followed to produce the vertical profiles. At this point we searched the optimal value of hz that would best reproduce the observed profile, by evaluating a standard χ2 function. N = 9 to 15 pixels were used to adequately sample the observed vertical profiles, depending on the wavelength. Uncertainties on the value of the scaleheight hz were also derived from the χ2 probability distribution. The results of these fits are listed in Table 4, together with the value of the PSF in linear units for each of the bands, and with the value of the vertical scaleheight derived from radiative transfer modelling at optical wavelengths. We consider that a galaxy has a spatially resolved vertical profile when the profile is not dominated by the telescope beam, that is when the deconvolved scaleheight value we derive from the profile fitting is not consistent with zero at the 5σ level.
Before the values of the scaleheight at different wavelengths can be compared with each other, and with the scaleheight derived from radiative transfer modelling, a number of issues need to be considered.
A first obvious concern when comparing the dust scaleheights derived in the different bands is the strongly different resolution of the images. Even at the shortest wavelength we have observed, 100 μm, the FWHM of the observations is  and it dominates the vertical distribution. This is in vast contrast with the optical images used for the radiative transfer modelling, which have ~1″ resolution. It can hence not be expected that both methods give comparable results.
Scaleheight (hz) values and related uncertainties as derived from the vertical profile fitting at 100, 160 and 250 μm, together with the physical scale of the PSF, given at each wavelength.
Derivation of the dust masses for the galaxies in our sample.
A second point to take into account is the effect of the inclination. For the scaleheights derived from radiative transfer modelling, the inclination of the dust disc has been taken into account (the inclination is always one of the crucial free parameters in the fitting procedure). In our simple fitting modelling approach of the Herschel profiles, we implicitly assume a perfectly edge-on disc. As the dust discs in spiral galaxies are extremely thin and radially extended, even a small deviation from a perfect edge-on orientation could strongly affect the observed “vertical” structure. In Appendix A we calculate the apparent vertical scaleheight that an infinitely thin exponential disc with radial scalelength hR would appear to have, if it were projected on the sky with inclination i, 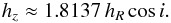 (5)In the last column of Table 4 we list this apparent scaleheight for the seven HEROES galaxies, based on the disc scalelength and inclination derived from the radiative transfer modelling. By looking at the values reported in this table, together with the profiles in Fig. 10, and taking into account the cautions expressed above, we can draw different conclusions regarding the vertical structure of the Herschel images. For four out of the seven galaxies in the sample (NGC 973, UGC 4277, IC 2531 and NGC 5529), the vertical profile is not resolved at the 5σ level, even at the shortest wavelength. It is not a coincidence that these four galaxies are the most distant ones in the sample.
For two galaxies in the sample, NGC 4217 and NGC 5907, the vertical profile is resolved at the 10σ level, in the PACS 100 and 160 μm bands. Remarkably, in both cases the scaleheight of the dust derived from the PACS observations is not in agreement with the values derived from the radiative transfer fitting: in the case of NGC 4217 the FIR scaleheight is substantially smaller than the value derived by Bianchi (2007), whereas for NGC 5907 it is more than twice as large as the value obtained by Xilouris et al. (1999). The key to these differences is the inclination of the galaxies: they are both more than 2 degrees from exactly edge-on. At these inclinations, the apparent vertical structure of galaxies can be explained as an infinitely thin exponential disc projected on the sky, as can be seen from the last column of Table 4.
Finally, for NGC 4013, we resolve the vertical structure marginally at the 5σ limit in the PACS 100 and 160 μm bands. With an inclination of 89 7, this galaxy has the closest to exactly edge-on orientation of all galaxies in the sample, and the vertical structure cannot be due to the projection along the line-of-sight of the radial structure. This is hence the only galaxy in the sample in which we find reliable evidence for vertically resolved dust emission. Interestingly, Howk & Savage (1999) found evidence for extraplanar dust from the analysis of extinction features in optical images for NGC 4013. The FIR-derived values for the scaleheight are in good agreement with the value derived from radiative transfer modelling by Bianchi (2007).
It is intriguing to see that the scaleheight seems to increase with increasing wavelength. It is tempting to interpret this as a natural consequence of the decreasing dust temperature that is expected if one goes to gradually higher distances above the plane of the galaxies. However, radiative transfer models have shown that vertical gradients in T due to diffuse dust heating are very shallow anyway (see e.g. Fig. 3 in Bianchi et al. 2000). Furthermore, this result is most probably driven by the size of the PSF’s FWHM which increases as a function of the wavelength. Thus, it is normal that the best fit value is somehow dependent on this (the same effect is also seen for the galaxies where we do not properly resolve the vertical structure).
6. Determination of the dust masses
To determine the total mass of the dust in the galaxies, we follow two different methods. Firstly, we use the results from fitting dust distribution models to V-band images due to extinction as given in Xilouris et al. (1997, 1999) and Bianchi (2007). For the second method, we determine the dust mass by fitting simple modified black-body models to the global Herschel fluxes.
6.1. Dust masses from radiative transfer fits
Xilouris et al. (1997, 1999) and Bianchi (2007) determined the intrinsic distribution of stars and dust in all HEROES galaxies by fitting radiative transfer models to V-band images. In their models, the dust mass density distributions are smooth, axisymmetric models with the double-exponential behaviour defined earlier in Eq. (1). Rather than the total dust mass, the quantity of dust in these models is usually parametrised by the face-on optical depth along the central line-of-sight. The connection between dust mass and the face-on optical depth follows directly from the definition of the latter quantity, 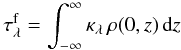 (6)with κλ the extinction coefficient for the dust at wavelength λ. Combining this expression with the density distribution (1) of the double-exponential disc model gives us
  (7)Adopting the value κV = 2619 m kg for the V-band dust extinction coefficient in the interstellar medium (Draine 2003) leads to the formula
  (8)which is virtually identical to Eq. (11) from Xilouris et al. (1997). When we substitute the values for hR and
  as derived by Xilouris et al. (1997, 1999) and Bianchi (2007), we obtain the dust masses listed in the fifth column of Table 5, where we added the superscript “opt” to indicate that it refers to the dust mass determined from radiative transfer fits to optical images. For the two galaxies in common between the samples used in the aforementioned works, NGC 4013 and NGC 5529, the derived dust mass estimates are nearly identical. This is particularly remarkable for NGC 4013, since the values for and hR obtained by the radiative transfer fits are quite different. This is due to a degeneracy in the radiative transfer modelling of edge-on spiral galaxies, which has been noted by Bianchi (2007) and De Geyter et al. (2013). Systems with a large face-on optical depth and a small dust scalelength and systems with a small face-on optical depth and a large dust scalelength can both result in similar edge-on optical depth and hence dust lanes of similar depths. Fortunately, the total dust mass, which is a combination of these parameters, is rather insensitive to this degeneracy.
6.2. Global SED fitting
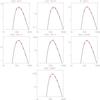 |
Fig. 11 SED fitting to the Herschel fluxes (here depicted as red diamonds) for all HEROES galaxies. A modified, single temperature black-body model (black line) is adopted. The y axes are in units of Jansky while the x axes are in micron. |
We also determined the dust masses for the galaxies in our sample by fitting a simple modified black-body model to the PACS and SPIRE data, i.e.  (9)where Md is the dust mass, Bν is the Planck function, Td is the dust temperature, D is the distance to the galaxy and κν is the dust emissivity. As customary, we assumed a power-law dust emissivity in the FIR/sub-mm wavelength range,
  (10)and we fix the value of the emissivity to κν = 0.192 m kg at 350 μm. The fits were done by performing a χ2 minimisation using a simple gradient search method, with Md and Td as free parameters, with β fixed to a value of 1.8. Error bars on the fitted parameters were derived using a bootstrapping method, as follows: when the best-fit parameters (Td, Md and β) are found, 200 new sets of datapoints are created by randomly drawing a value from the observed fluxes, lying within the observed errorbars. A best fit is searched for each one of these new artificial datasets: 16% of the best fit models having the lower and higher parameters values are discarded, and uncertainties are then taken as the differences between the best fit solution and the extreme values.
The results of these modified black-body fits are shown in Fig. 11 and listed in the last two columns of Table 5 (the dust masses as derived from the SED fits are denoted as  to make the distinction with the optically determined dust masses). Had we left the emissivity index, β, as a free parameter, we would have found an average value of ⟨ β ⟩ = 1.73 ± 0.36, very close to the value we have used for the fits. Using the same value for the emissivity index allows us to compare, in a consistent manner, the dust mass values we derive. Furthermore, this value of β and the average temperature ⟨ Td ⟩ = (19.8 ± 1.6) K, that we obtain, are very typical values for the interstellar dust medium in spiral galaxies (e.g. Dunne et al. 2011; Davies et al. 2012; Smith et al. 2012; Boselli et al. 2012; Galametz et al. 2012). As the latter model only reproduces datapoints longwards of 100 μm, the dust mass values we give do not take into account the possible presence of warmer dust, whose signature would show up at shorter wavelengths. The latter, anyway, constitutes a minor fraction of the total dust mass (see, e.g. Smith et al. 2010).
6.3. Comparison of optical and FIR dust masses
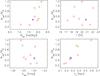 |
Fig. 12 Comparison of the difference in the values of the dust mass as computed from radiative transfer modelling of optical data and as computed from black-body fitting of Herschel datapoints, with various physical quantities: the (optically derived) mass of dust, the dust temperature, the absolute K-band magnitude and the dust scaleheight. The starred points correspond to two other well known edge-on galaxies not included in our sample: NGC 891 (blue) and NGC 4565 (green). |
When we compare the total dust masses as they were determined from both methods described in the previous subsections, we see a clear difference between the different mass estimates, with the ones derived from radiative transfer fits of the optical images being consistently smaller than the dust masses derived from the FIR emission. Only for NGC 973, both dust masses are in agreement, while for all other galaxies the optically determined dust mass significantly underestimates the FIR dust mass, by a factor of up to about four. Such a mass discrepancy was previously found in a number of edge-on spiral galaxies (Popescu et al. 2000; Misiriotis et al. 2001; Alton et al. 2004; Dasyra et al. 2005; Bianchi 2008; Baes et al. 2010; De Looze et al. 2012a). Our new observations, which also cover the sub-mm part of the SED and hence allow a solid determination of the bulk of the cold dust, confirm the results of these studies.
In order to investigate the underlying mechanism of this discrepancy, we look for possible relations between the ratio of the optical and FIR dust masses and a number of global galaxy properties. Figure 12 plots  as a function of dust mass, dust temperature, K-band absolute magnitude (used as a proxy for stellar mass), and dust vertical scaleheight. To increase the statistics, we include two additional notorious edge-on spiral galaxies in this figure, i.e. the prototypical edge-on spiral NGC 891 (blue asterisk) and NGC 4565, also known as the Needle Galaxy (green asterisk). To determine the FIR dust mass, we have used Herschel fluxes from Bianchi & Xilouris (2011) and De Looze et al. (2012a), respectively, and a similar fitting technique was used as for the HEROES galaxies. Optical dust masses were taken from radiative transfer modelling from Xilouris et al. (1998) and Alton et al. (2004). We have assumed distances of 9.5 and 16.9 Mpc for NGC 891 and NGC 4565, respectively.
Looking at Fig. 12, we see no correlation between the dust mass discrepancy and the dust mass, stellar mass or dust temperature. Interestingly, we do find a trend between the dust mass discrepancy and the dust scaleheight as derived from radiative transfer fits to the optical images. To understand this trend, we note that the dust mass computed from extinction in optical images is only sensitive to the smoothly distributed fraction: in fact, the physical size of the dense, optically thick molecular clouds often hosting regions of active star formation, is too small for being detected by optical observations even for such relatively nearby galaxies, as those of the HEROES sample are. The net effect is that these small clumpy regions do not contribute to the global optical extinction at all. Their presence can only be revealed from the thermal emission of the dust they contain, showing up in the FIR (see e.g. Popescu et al. 2000). Hence, one of the possible interpretations of this dust mass discrepancy is that this ratio would be a measure of the clumpiness of the dust fraction of the ISM in a galaxy. A correlation between this difference and the scaleheight of dust would imply that the thinner the dust disc is, the clumpier its structure is. With only 9 objects being considered, one of which not lying perfectly on the correlation, we cannot be conclusive on this point, even though our analysis hints at a real relation, and it is furthermore supported by a Spearman correlation coefficient of 0.92.
7. Discussion and conclusions
We have presented Herschel observations of a sample of seven edge-on spiral galaxies within the HEROES project. This work is the first one of a series of papers aiming at a systematic study of the properties of dust, and its relation to the stellar and gas components, in edge-on spiral galaxies. Here we have presented FIR and sub-mm data obtained with the Herschel Space Observatory, describing and analysing both the morphology and the horizontal and vertical distribution of dust.
We have measured the global FIR/sub-mm fluxes of the galaxies in the PACS and SPIRE bands using aperture photometry. We have compared the Herschel fluxes with IRAS, ISO, Akari and Planck fluxes at similar wavelengths. We find excellent agreement between Herschel on the one side and IRAS, ISO and Planck on the other side. The only exception is NGC 5907, where both the IRAS 100 μm and the ISO 160 μm fluxes underestimate the PACS fluxes. We argue that this disagreement might be due to the large extent of this galaxy, which is spatially resolved even at the course resolution of IRAS and ISO. When we compare the PACS 160 μm fluxes with the Akari 160 μm fluxes, we find a strong inconsistency, with the Akari fluxes a factor two smaller, possibly due to a flux measurement effect.
We have described the resulting FIR morphology. A double-exponential disc model for the dust distribution is capable of providing a good description of the observed IR and sub-mm profiles, especially at 500 μm, and as long as disc truncation is not taken into account. But at shorter wavelengths, the picture is more complicated: on the one hand, the occurrence of primary and several secondary peaks in the horizontal FIR/sub-mm profiles give a clear indication of morphological structure in the form of arms, rings or individual star formation complexes. On the other hand, the underlying horizontal data profiles (taking abstraction of the peaks) show a more complicated and varying behaviour across the horizontal span of the galaxies and especially at the PACS wavelengths. Quite interestingly, the two galaxies likely to host some nuclear activity, and classified as Seyfert 2 and LINER (NGC 973 and NGC 4013 respectively), are those showing the most prominent central peak at 100 μm, giving a hint of the presence of warmer or more concentrated dust. We have checked whether these peaks are compatible with a point-like emission, as expected – at these resolutions – for an AGN-like source. We found that the central peak is compatible with a Gaussian profile emission, imposing upper limits on the FWHM of the central source of ~450 and ~120 pc for NGC 973 and NGC 4013 respectively. These values are quite high if compared to the physical scales, of the order of a few pc, found for the dusty tori of local low luminosity AGNs (see e.g. Jaffe et al. 2004), whose emission peaks anyway around 30 to 50 μm (as IR modelling indicates; see e.g. Fritz et al. 2006; Stalevski et al. 2012). Our upper limits fit a picture where the intense UV/optical radiation field emitted by the central source would heat the dust to slightly larger scales, but to lower temperatures. This hypothesis has so far never been tested, but it is in principle verifiable by means of radiative transfer models.
By fitting an exponential model to the vertical profile of the Herschel images, we investigate whether we can detect vertically extended dust in edge-on galaxies. Evidence for extraplanar dust has been found before, either by means of extinction features in high-resolution optical images (Howk & Savage 1999; Alton et al. 2000b; Thompson et al. 2004) or through warm dust or PAH emission at mid-infrared wavelengths (Irwin & Madden 2006; Irwin et al. 2007; Kamphuis et al. 2007; Whaley et al. 2009). Three out of the seven galaxies show signatures of extended vertical emission at 100 and 160 μm at the 5σ level. For two of these three galaxies (NGC 4217 and NGC 5907), this vertically extended emission is most probably due to projection effects as a result of deviations from an exactly edge-on orientation. For the remaining galaxy, NGC 4013, the FIR/sub-mm emission seems truly resolved, and the inferred scaleheights are in agreement with the scaleheight independently derived or radiative transfer modelling of the optical images by Bianchi (2007). We find a hint of an increase in the scaleheight with FIR wavelength; rather than interpreting this as evidence that the dust temperature decreases with increasing distance above the plane of the galaxy, we argue that this is probably due to the limited and gradually worsening resolution of the Herschel images for increasing wavelengths.
Finally, total dust masses inferred from the optical extinction through radiative transfer models were compared with those determined from modified black-body fits to the FIR fluxes, and correlations with other physical and geometrical properties of the galaxies were searched for. While we do acknowledge that our sample – which we extended with two other well-known edge-on galaxies for this particular analysis – is quite limited to provide strong evidence, we found a hint of a correlation between the discrepancy between both dust masses and the vertical scaleheight of the dust: larger differences are found in galaxies with smaller scaleheights. If the discrepancy between the dust mass as derived from optical extinction and that calculated from IR emission is interpreted as a measure of the clumpiness of the ISM, this would be consistent with a picture where dust which is more “compressed” into the disc, would tend to be gathered in clumps more strongly, as opposed to a smoother, continuous distribution. While we are not aware of any study addressing this issue, this correlation will be tested by means of radiative transfer models. By exploiting a state-of-the-art radiative transfer code coupled with a robust fitting algorithm, we should be able to at least confirm the presence of this trend. In fact, following the approach already used by Popescu et al. (2000); Bianchi et al. (2000) and more recently De Looze et al. (2012a), the FIR luminosity deficit always observed in models can be accounted for by including in the model, a posteriori, a dust emission component originating from very compact regions, hence invisible in optical extinction maps. The relative amount of this component with respect to the diffuse dust can then be compared to the dust scaleheight derived from the model itself and this, in turn, checked against our findings.
A complementary programme to HEROES, the New HErschel Multi-wavelength Extragalactic Survey of Edge-on Spirals (NHEMESES) is devoted to the study of the interstellar dust medium in a set of galaxies with vrot < 120 km s (Holwerda et al. 2012a,b).
PACS Photometer Passbands and Colour Correction Factors for Various Source SEDs, April 12, 2011.
Version 2.4, June 7, 2011.
See “PACS Observer’s Manual”, Version 2.3, and “SPIRE Observer’s Manual”, Version 2.4.
Acknowledgments
J.V., M.B., F.A., G.D.G., G.G. and S.V. acknowledge the support of the Flemish Fund for Scientific Research (FWO-Vlaanderen). J.F., M.B. and J.A.D.L.B. are grateful for the support from the Belgian Science Policy Office (BELSPO). PACS has been developed by a consortium of institutes led by MPE (Germany) and including UVIE (Austria); KU Leuven, CSL, IMEC (Belgium); CEA, LAM (France); MPIA (Germany); INAFIFSI/ OAA/OAP/OAT, LENS, SISSA (Italy); IAC (Spain). This development has been supported by the funding agencies BMVIT (Austria), ESA-PRODEX (Belgium), CEA/CNES (France), DLR (Germany), ASI/INAF (Italy), and CICYT/MCYT (Spain). SPIRE has been developed by a consortium of institutes led by Cardiff University (UK) and including Univ. Lethbridge (Canada); NAOC (China); CEA, LAM (France); IFSI, Univ. Padua (Italy); IAC (Spain); Stockholm Observatory (Sweden); Imperial College London, RAL, UCL-MSSL, UKATC, Univ. Sussex (UK); and Caltech, JPL, NHSC, Univ. Colorado (USA). This development has been supported by national funding agencies: CSA (Canada); NAOC (China); CEA, CNES, CNRS (France); ASI (Italy); MCINN (Spain); Stockholm Observatory (Sweden); STFC (UK); and NASA (USA). HSpot and HIPE are joint developments by the Herschel Science Ground Segment Consortium, consisting of ESA, the NASA Herschel Science Center, and the HIFI, PACS and SPIRE consortia. This research has made use of NASA’s Astrophysics Data System, and of the NASA/IPAC Extragalactic Database (NED) which is operated by the Jet Propulsion Laboratory, California Institute of Technology, under contract with the National Aeronautics and Space Administration. We wish to thank the anonymous referee for the comments and suggestions, which helped us to improve this work.
References
- Alton, P. B., Bianchi, S., Rand, R. J., et al. 1998, ApJ, 507, L125 [NASA ADS] [CrossRef] [Google Scholar]
- Alton, P. B., Rand, R. J., Xilouris, E. M., et al. 2000a, A&AS, 145, 83 [NASA ADS] [CrossRef] [EDP Sciences] [Google Scholar]
- Alton, P. B., Xilouris, E. M., Bianchi, S., Davies, J., & Kylafis, N. 2000b, A&A, 356, 795 [NASA ADS] [Google Scholar]
- Alton, P. B., Xilouris, E. M., Misiriotis, A., Dasyra, K. M., & Dumke, M. 2004, A&A, 425, 109 [NASA ADS] [CrossRef] [EDP Sciences] [Google Scholar]
- Aniano, G., Draine, B. T., Gordon, K. D., & Sandstrom, K. 2011, PASP, 123, 1218 [NASA ADS] [CrossRef] [Google Scholar]
- Aniano, G., Draine, B. T., Calzetti, D., et al. 2012, ApJ, 756, 138 [NASA ADS] [CrossRef] [Google Scholar]
- Baes, M., Davies, J. I., Dejonghe, H., et al. 2003, MNRAS, 343, 1081 [NASA ADS] [CrossRef] [Google Scholar]
- Baes, M., Fritz, J., Gadotti, D. A., et al. 2010, A&A, 518, L39 [NASA ADS] [CrossRef] [EDP Sciences] [Google Scholar]
- Baes, M., Verstappen, J., De Looze, I., et al. 2011, ApJS, 196, 22 [NASA ADS] [CrossRef] [Google Scholar]
- Barnaby, D., & Thronson H. A., Jr. 1992, AJ, 103, 41 [NASA ADS] [CrossRef] [Google Scholar]
- Bendo, G. J., Wilson, C. D., Pohlen, M., et al. 2010, A&A, 518, L65 [NASA ADS] [CrossRef] [EDP Sciences] [Google Scholar]
- Bendo, G. J., Boselli, A., Dariush, A., et al. 2012, MNRAS, 419, 1833 [NASA ADS] [CrossRef] [Google Scholar]
- Bianchi, S. 2007, A&A, 471, 765 [NASA ADS] [CrossRef] [EDP Sciences] [Google Scholar]
- Bianchi, S. 2008, A&A, 490, 461 [NASA ADS] [CrossRef] [EDP Sciences] [Google Scholar]
- Bianchi, S., & Xilouris, E. M. 2011, A&A, 531, L11 [NASA ADS] [CrossRef] [EDP Sciences] [Google Scholar]
- Bianchi, S., Davies, J. I., & Alton, P. B. 2000, A&A, 359, 65 [NASA ADS] [Google Scholar]
- Boquien, M., Buat, V., Boselli, A., et al. 2012, A&A, 539, A145 [NASA ADS] [CrossRef] [EDP Sciences] [Google Scholar]
- Boselli, A., Ciesla, L., Cortese, L., et al. 2012, A&A, 540, A54 [NASA ADS] [CrossRef] [EDP Sciences] [Google Scholar]
- Bottema, R. 1995, A&A, 295, 605 [NASA ADS] [Google Scholar]
- Bottema, R. 1996, A&A, 306, 345 [NASA ADS] [Google Scholar]
- Bottema, R., Shostak, G. S., & van der Kruit, P. C. 1987, Nature, 328, 401 [NASA ADS] [CrossRef] [Google Scholar]
- Comerón, S., Elmegreen, B. G., Knapen, J. H., et al. 2011, ApJ, 738, L17 [NASA ADS] [CrossRef] [Google Scholar]
- Dalcanton, J. J., Yoachim, P., & Bernstein, R. A. 2004, ApJ, 608, 189 [NASA ADS] [CrossRef] [Google Scholar]
- Dale, D. A., Aniano, G., Engelbracht, C. W., et al. 2012, ApJ, 745, 95 [NASA ADS] [CrossRef] [Google Scholar]
- Dasyra, K. M., Xilouris, E. M., Misiriotis, A., & Kylafis, N. D. 2005, A&A, 437, 447 [NASA ADS] [CrossRef] [EDP Sciences] [Google Scholar]
- Davies, J. I., Bianchi, S., Cortese, L., et al. 2012, MNRAS, 419, 3505 [NASA ADS] [CrossRef] [Google Scholar]
- De Geyter, G., Baes, M., Fritz, J., & Camps, P. 2013, A&A, 550, A74 [NASA ADS] [CrossRef] [EDP Sciences] [Google Scholar]
- de Grijs, R., & Peletier, R. F. 2000, MNRAS, 313, 800 [NASA ADS] [CrossRef] [Google Scholar]
- de Grijs, R., & van der Kruit, P. C. 1996, A&AS, 117, 19 [NASA ADS] [CrossRef] [EDP Sciences] [Google Scholar]
- De Looze, I., Baes, M., Bendo, G. J., et al. 2012a, MNRAS, 427, 2797 [NASA ADS] [CrossRef] [Google Scholar]
- De Looze, I., Baes, M., Fritz, J., & Verstappen, J. 2012b, MNRAS, 419, 895 [NASA ADS] [CrossRef] [Google Scholar]
- De Looze, I., Baes, M., Parkin, T. J., et al. 2012c, MNRAS, 423, 2359 [NASA ADS] [CrossRef] [Google Scholar]
- de Souza, R. E., & Dos Anjos, S. 1987, A&AS, 70, 465 [NASA ADS] [Google Scholar]
- Domingue, D. L., Keel, W. C., & White, III, R. E. 2000, ApJ, 545, 171 [NASA ADS] [CrossRef] [Google Scholar]
- Draine, B. T. 2003, ApJ, 598, 1017 [NASA ADS] [CrossRef] [Google Scholar]
- Draine, B. T., Dale, D. A., Bendo, G., et al. 2007, ApJ, 663, 866 [NASA ADS] [CrossRef] [Google Scholar]
- Dunne, L., Eales, S., Edmunds, M., et al. 2000, MNRAS, 315, 115 [NASA ADS] [CrossRef] [Google Scholar]
- Dunne, L., Gomez, H. L., da Cunha, E., et al. 2011, MNRAS, 417, 1510 [NASA ADS] [CrossRef] [Google Scholar]
- Dupac, X., del Burgo, C., Bernard, J.-P., et al. 2003, MNRAS, 344, 105 [NASA ADS] [CrossRef] [Google Scholar]
- Florido, E., Prieto, M., Battaner, E., et al. 1991, A&A, 242, 301 [NASA ADS] [Google Scholar]
- Foyle, K., Wilson, C. D., Mentuch, E., et al. 2012, MNRAS, 421, 2917 [NASA ADS] [CrossRef] [Google Scholar]
- Fritz, J., Franceschini, A., & Hatziminaoglou, E. 2006, MNRAS, 366, 767 [Google Scholar]
- Fritz, J., Gentile, G., Smith, M. W. L., et al. 2012, A&A, 546, A34 [NASA ADS] [CrossRef] [EDP Sciences] [Google Scholar]
- Galametz, M., Kennicutt, R. C., Albrecht, M., et al. 2012, MNRAS, 425, 763 [NASA ADS] [CrossRef] [Google Scholar]
- Griffin, M. J., Abergel, A., Abreu, A., et al. 2010, A&A, 518, L3 [Google Scholar]
- Guthrie, B. N. G. 1992, A&AS, 93, 255 [NASA ADS] [Google Scholar]
- Holwerda, B. W., Gonzalez, R. A., Allen, R. J., & van der Kruit, P. C. 2005a, AJ, 129, 1381 [NASA ADS] [CrossRef] [Google Scholar]
- Holwerda, B. W., González, R. A., van der Kruit, P. C., & Allen, R. J. 2005b, A&A, 444, 109 [NASA ADS] [CrossRef] [EDP Sciences] [Google Scholar]
- Holwerda, B. W., Keel, W. C., & Bolton, A. 2007a, AJ, 134, 2385 [NASA ADS] [CrossRef] [Google Scholar]
- Holwerda, B. W., Meyer, M., Regan, M., et al. 2007b, AJ, 134, 1655 [NASA ADS] [CrossRef] [Google Scholar]
- Holwerda, B. W., Keel, W. C., Williams, B., Dalcanton, J. J., & de Jong, R. S. 2009, AJ, 137, 3000 [NASA ADS] [CrossRef] [Google Scholar]
- Holwerda, B. W., Bianchi, S., Baes, M., et al. 2012a, in IAU Symp., 284, 128 [Google Scholar]
- Holwerda, B. W., Bianchi, S., Böker, T., et al. 2012b, A&A, 541, L5 [NASA ADS] [CrossRef] [EDP Sciences] [Google Scholar]
- Holwerda, B. W., Allen, R. J., de Blok, W. J. G., et al. 2013, Astron. Nachr., 334, 268 [NASA ADS] [Google Scholar]
- Howk, J. C. 2009 [arXiv:0904.4928] [Google Scholar]
- Howk, J. C., & Savage, B. D. 1999, AJ, 117, 2077 [NASA ADS] [CrossRef] [Google Scholar]
- Irwin, J. A., & Madden, S. C. 2006, A&A, 445, 123 [NASA ADS] [CrossRef] [EDP Sciences] [MathSciNet] [Google Scholar]
- Irwin, J. A., Kennedy, H., Parkin, T., & Madden, S. 2007, A&A, 474, 461 [NASA ADS] [CrossRef] [EDP Sciences] [Google Scholar]
- Jaffe, W., Meisenheimer, K., Röttgering, H. J. A., et al. 2004, Nature, 429, 47 [NASA ADS] [CrossRef] [PubMed] [Google Scholar]
- Jarvis, B. J. 1986, AJ, 91, 65 [NASA ADS] [CrossRef] [Google Scholar]
- Just, A., Fuchs, B., & Wielen, R. 1996, A&A, 309, 715 [NASA ADS] [Google Scholar]
- Kamphuis, P., Holwerda, B. W., Allen, R. J., Peletier, R. F., & van der Kruit, P. C. 2007, A&A, 471, L1 [NASA ADS] [CrossRef] [EDP Sciences] [Google Scholar]
- Keel, W. C., & White, III, R. E. 2001a, AJ, 121, 1442 [NASA ADS] [CrossRef] [Google Scholar]
- Keel, W. C., & White, III, R. E. 2001b, AJ, 122, 1369 [NASA ADS] [CrossRef] [Google Scholar]
- Kennicutt, R. C., Calzetti, D., Aniano, G., et al. 2011, PASP, 123, 1347 [NASA ADS] [CrossRef] [Google Scholar]
- Kregel, M., van der Kruit, P. C., & de Grijs, R. 2002, MNRAS, 334, 646 [NASA ADS] [CrossRef] [Google Scholar]
- Kuchinski, L. E., Terndrup, D. M., Gordon, K. D., & Witt, A. N. 1998, AJ, 115, 1438 [NASA ADS] [CrossRef] [Google Scholar]
- Kylafis, N. D., & Bahcall, J. N. 1987, ApJ, 317, 637 [NASA ADS] [CrossRef] [Google Scholar]
- Lisenfeld, U., Verdes-Montenegro, L., Sulentic, J., et al. 2007, A&A, 462, 507 [NASA ADS] [CrossRef] [EDP Sciences] [Google Scholar]
- Mentuch Cooper, E., Wilson, C. D., Foyle, K., et al. 2012, ApJ, 755, 165 [NASA ADS] [CrossRef] [Google Scholar]
- Miller, S. T., & Veilleux, S. 2003, ApJS, 148, 383 [NASA ADS] [CrossRef] [Google Scholar]
- Misiriotis, A., Popescu, C. C., Tuffs, R., & Kylafis, N. D. 2001, A&A, 372, 775 [NASA ADS] [CrossRef] [EDP Sciences] [Google Scholar]
- Morrison, H. L., Boroson, T. A., & Harding, P. 1994, AJ, 108, 1191 [NASA ADS] [CrossRef] [Google Scholar]
- Moshir, M., Kopan, G., Conrow, T., et al. 1990, in BAAS, 22, 1325 [Google Scholar]
- Ott, S. 2010, in Astronomical Data Analysis Software and Systems XIX, eds. Y. Mizumoto, K.-I. Morita, & M. Ohishi, ASP Conf. Ser., 434, 139 [Google Scholar]
- PACS Observer’s Manual 2011, Herschel Space Observatory, http://herschel.esac.esa.int/Docs/PACS/html/pacs_om.html [Google Scholar]
- Pérez García, A. M., & Rodríguez Espinosa, J. M. 2001, ApJ, 557, 39 [NASA ADS] [CrossRef] [Google Scholar]
- Pilbratt, G. L., Riedinger, J. R., Passvogel, T., et al. 2010, A&A, 518, L1 [CrossRef] [EDP Sciences] [Google Scholar]
- Pildis, R. A., Bregman, J. N., & Schombert, J. M. 1994, ApJ, 427, 160 [NASA ADS] [CrossRef] [Google Scholar]
- Planck Collaboration. 2011, A&A, 536, A7 [NASA ADS] [CrossRef] [EDP Sciences] [Google Scholar]
- Poglitsch, A., Waelkens, C., Geis, N., et al. 2010, A&A, 518, L2 [NASA ADS] [CrossRef] [EDP Sciences] [Google Scholar]
- Pohlen, M., Cortese, L., Smith, M. W. L., et al. 2010, A&A, 518, L72 [NASA ADS] [CrossRef] [EDP Sciences] [Google Scholar]
- Popescu, C. C., & Tuffs, R. J. 2002, MNRAS, 335, L41 [NASA ADS] [CrossRef] [Google Scholar]
- Popescu, C. C., & Tuffs, R. J. 2003, A&A, 410, L21 [NASA ADS] [CrossRef] [EDP Sciences] [Google Scholar]
- Popescu, C. C., Misiriotis, A., Kylafis, N. D., Tuffs, R. J., & Fischera, J. 2000, A&A, 362, 138 [NASA ADS] [Google Scholar]
- Popescu, C. C., Tuffs, R. J., Dopita, M. A., et al. 2011, A&A, 527, A109 [NASA ADS] [CrossRef] [EDP Sciences] [Google Scholar]
- Roussel, H. 2013, PASP, submitted [arXiv:1205.2576] [Google Scholar]
- Sanchez-Saavedra, M. L., Battaner, E., & Florido, E. 1990, MNRAS, 246, 458 [NASA ADS] [Google Scholar]
- Sancisi, R. 1976, A&A, 53, 159 [NASA ADS] [Google Scholar]
- Sandage, A., & Bedke, J. 1994a, The Carnegie Atlas of Galaxies, Volumes I, II (Carnegie Institution of Washington Publ.) [Google Scholar]
- Sandage, A., & Bedke, J. 1994b, The Carnegie Atlas of Galaxies, Volumes I, II (Carnegie Institution of Washington Publ.) [Google Scholar]
- Sanders, D. B., Mazzarella, J. M., Kim, D.-C., Surace, J. A., & Soifer, B. T. 2003, AJ, 126, 1607 [Google Scholar]
- Shang, Z., Zheng, Z., Brinks, E., et al. 1998, ApJ, 504, L23 [NASA ADS] [CrossRef] [Google Scholar]
- Smith, M. W. L., Vlahakis, C., Baes, M., et al. 2010, A&A, 518, L51 [NASA ADS] [CrossRef] [EDP Sciences] [Google Scholar]
- Smith, M. W. L., Eales, S. A., Gomez, H. L., et al. 2012, ApJ, 756, 40 [NASA ADS] [CrossRef] [Google Scholar]
- Soifer, B. T., Sanders, D. B., Madore, B. F., et al. 1987, ApJ, 320, 238 [NASA ADS] [CrossRef] [Google Scholar]
- Soifer, B. T., Boehmer, L., Neugebauer, G., & Sanders, D. B. 1989, AJ, 98, 766 [NASA ADS] [CrossRef] [Google Scholar]
- SPIRE Observer’s Manual 2011, Herschel Space Observatory, http://herschel.esac.esa.int/Docs/SPIRE/html/spire_om.html [Google Scholar]
- Stalevski, M., Fritz, J., Baes, M., Nakos, T., & Popović, L. Č. 2012, MNRAS, 420, 2756 [NASA ADS] [CrossRef] [Google Scholar]
- Stickel, M., Lemke, D., Klaas, U., Krause, O., & Egner, S. 2004, A&A, 422, 39 [NASA ADS] [CrossRef] [EDP Sciences] [Google Scholar]
- Thompson, T. W. J., Howk, J. C., & Savage, B. D. 2004, AJ, 128, 662 [NASA ADS] [CrossRef] [Google Scholar]
- Tuffs, R. J., Popescu, C. C., Pierini, D., et al. 2002, ApJS, 139, 37 [NASA ADS] [CrossRef] [Google Scholar]
- Wainscoat, R. J., Freeman, K. C., & Hyland, A. R. 1989, ApJ, 337, 163 [NASA ADS] [CrossRef] [Google Scholar]
- Whaley, C. H., Irwin, J. A., Madden, S. C., Galliano, F., & Bendo, G. J. 2009, MNRAS, 395, 97 [NASA ADS] [CrossRef] [Google Scholar]
- Xilouris, E. M., Kylafis, N. D., Papamastorakis, J., Paleologou, E. V., & Haerendel, G. 1997, A&A, 325, 135 [NASA ADS] [Google Scholar]
- Xilouris, E. M., Alton, P. B., Davies, J. I., et al. 1998, A&A, 331, 894 [NASA ADS] [Google Scholar]
- Xilouris, E. M., Byun, Y. I., Kylafis, N. D., Paleologou, E. V., & Papamastorakis, J. 1999, A&A, 344, 868 [NASA ADS] [Google Scholar]
- Xilouris, E. M., Tabatabaei, F. S., Boquien, M., et al. 2012, A&A, 543, A74 [NASA ADS] [CrossRef] [EDP Sciences] [Google Scholar]
- Yamamura, I., Makiuti, S., Ikeda, N., et al. 2010, VizieR Online Data Catalog, II/298 [Google Scholar]
Appendix A: The effect of the inclination on the vertical structure
In this Appendix we investigate how deviations from an exactly edge-on orientation affect the apparent vertical structure of edge-on galaxies in the FIR/sub-mm maps. Consider first a double-exponential disc, described by the three-dimensional density distribution (1) and the dust surface density distribution (2) when viewed exactly edge-on. When we collapse the surface density distribution in the horizontal direction and normalise the resulting expression, we recover a simple exponential function as the vertical profile 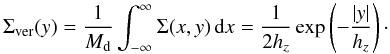 (A.1)Now assume a system in which the dust is distributed in an infinitely thin, exponential disc, i.e. with a density distribution like Eq. (1) with hz → 0,
 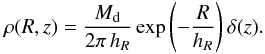 (A.2)When this disc has an inclination i, it has as mass surface density distribution projected on the sky
 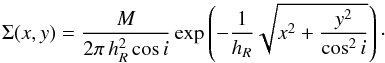 (A.3)When we collapse this surface density profile in the horizontal direction and normalise, we find
 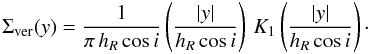 (A.4)When an infinitesimally thin exponential disc is not exactly edge-on, it will hence give rise to a vertical profile that is extended, which could be falsely interpreted as an intrinsical vertical distribution of an exactly edge-on spiral galaxy. To determine the importance of this inclination effect, we estimate the exponential scaleheight hz that would correspond to the vertical profile (A.4), by requiring the FWHM of both distributions to be equal. For the expression (A.4) we find
  (A.5)whereas the exponential profile (A.1) gives
  (A.6)and therefore
  (A.7)The values we obtain using this formula for the seven HEROES galaxies are listed in the last column of Table 4.
All Tables
Global PACS and SPIRE fluxes and the major and minor semi-axes of the used elliptical apertures for the galaxies in the sample.
Scaleheight (hz) values and related uncertainties as derived from the vertical profile fitting at 100, 160 and 250 μm, together with the physical scale of the PSF, given at each wavelength.
All Figures
|
Fig. 1 Comparison between the PACS 100 μm, PACS 160 μm and SPIRE 350 μm fluxes with IRAS, ISO, Akari and Planck fluxes. |
| In the text | |
|
Fig. 2 Optical V-band and Herschel PACS and SPIRE images for NGC 973. The image sizes are about 6′ × 3′. The orientation and angular scale are given in the top right panel. The band for each panel is shown in its bottom right corner, with the Herschel beam size indicated by the circle in its bottom left corner. |
| In the text | |
|
Fig. 3 Optical V-band and Herschel PACS and SPIRE images for UGC 4277. The image sizes are about 6′ × 3′. |
| In the text | |
|
Fig. 4 Optical V-band and Herschel PACS and SPIRE images for IC 2531. The image sizes are about 6′ × 3′. |
| In the text | |
|
Fig. 5 Optical V-band and Herschel PACS and SPIRE images for NGC 4013. The image sizes are about 6′ × 3′. |
| In the text | |
|
Fig. 6 Optical V-band and Herschel PACS and SPIRE images for NGC 4217. The image sizes are about 6′ × 3′. |
| In the text | |
|
Fig. 7 Optical V-band and Herschel PACS and SPIRE images for NGC 5529. The image sizes are about 6′ × 3′. |
| In the text | |
|
Fig. 8 Optical V-band and Herschel PACS and SPIRE images for NGC 5907. The image sizes are 10′ × 5′. |
| In the text | |
|
Fig. 9 Horizontal profiles for the galaxies in the sample, at Herschel wavelengths. An arbitrary offset was introduced between different wavelengths for the sake of visualisation. A corresponding profile resulting from the double-exponential model is overplotted with black crosses, to compare with the commonly adopted description of the spatial dust distribution. The profiles are oriented as in the maps. |
| In the text | |
|
Fig. 10 Vertical, normalised, profiles at 100, 160 and 250 μm are plotted as green crosses, to which we superimpose, as a blue line, a fit with an exponential profile, convolved with the Herschel beam at the appropriate wavelength (depicted here as a red line). |
| In the text | |
|
Fig. 11 SED fitting to the Herschel fluxes (here depicted as red diamonds) for all HEROES galaxies. A modified, single temperature black-body model (black line) is adopted. The y axes are in units of Jansky while the x axes are in micron. |
| In the text | |
|
Fig. 12 Comparison of the difference in the values of the dust mass as computed from radiative transfer modelling of optical data and as computed from black-body fitting of Herschel datapoints, with various physical quantities: the (optically derived) mass of dust, the dust temperature, the absolute K-band magnitude and the dust scaleheight. The starred points correspond to two other well known edge-on galaxies not included in our sample: NGC 891 (blue) and NGC 4565 (green). |
| In the text | |
Current usage metrics show cumulative count of Article Views (full-text article views including HTML views, PDF and ePub downloads, according to the available data) and Abstracts Views on Vision4Press platform.
Data correspond to usage on the plateform after 2015. The current usage metrics is available 48-96 hours after online publication and is updated daily on week days.
Initial download of the metrics may take a while.