Free Access
Fig. 10
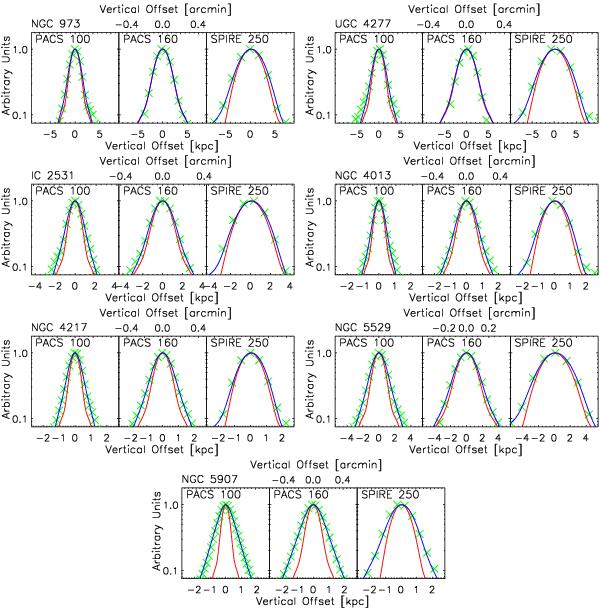
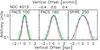
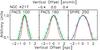
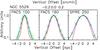
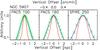
Vertical, normalised, profiles at 100, 160 and 250 μm are plotted as green crosses, to which we superimpose, as a blue line, a fit with an exponential profile, convolved with the Herschel beam at the appropriate wavelength (depicted here as a red line).
This figure is made of several images, please see below:
Current usage metrics show cumulative count of Article Views (full-text article views including HTML views, PDF and ePub downloads, according to the available data) and Abstracts Views on Vision4Press platform.
Data correspond to usage on the plateform after 2015. The current usage metrics is available 48-96 hours after online publication and is updated daily on week days.
Initial download of the metrics may take a while.