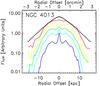
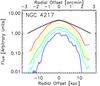
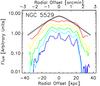
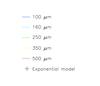
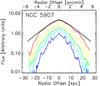
Fig. 9
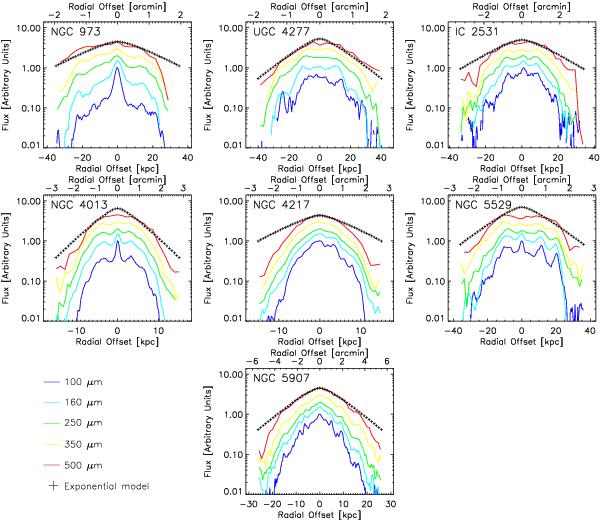
Horizontal profiles for the galaxies in the sample, at Herschel wavelengths. An arbitrary offset was introduced between different wavelengths for the sake of visualisation. A corresponding profile resulting from the double-exponential model is overplotted with black crosses, to compare with the commonly adopted description of the spatial dust distribution. The profiles are oriented as in the maps.
Current usage metrics show cumulative count of Article Views (full-text article views including HTML views, PDF and ePub downloads, according to the available data) and Abstracts Views on Vision4Press platform.
Data correspond to usage on the plateform after 2015. The current usage metrics is available 48-96 hours after online publication and is updated daily on week days.
Initial download of the metrics may take a while.