| Issue |
A&A
Volume 555, July 2013
|
|
|---|---|---|
| Article Number | A135 | |
| Number of page(s) | 8 | |
| Section | Galactic structure, stellar clusters and populations | |
| DOI | https://doi.org/10.1051/0004-6361/201321362 | |
| Published online | 12 July 2013 | |
Reaction of massive clusters to gas expulsion – The cluster density dependence
Max-Planck-Institut für Radioastronomie, Auf dem Hügel 69, 53121 Bonn, Germany
e-mail: spfalzner@mpifr.de
Received: 26 February 2013
Accepted: 28 May 2013
Context. The expulsion of the unconverted gas at the end of the star formation process potentially leads to the expansion of the just formed stellar cluster and membership loss. The degree of expansion and mass loss depends largely on the star formation efficiency and scales with the mass and size of the stellar group when stellar interactions can be neglected.
Aims. We investigate the circumstances in which stellar interactions between cluster members become so important that the fraction of bound stars after gas expulsion is significantly altered.
Methods. The Nbody6 code is used to simulate the cluster dynamics after gas expulsion for different star formation efficiences. Concentrating on the most massive clusters observed in the Milky Way, we test to what extent the results depend on the model, i.e. stellar mass distribution, stellar density profile etc., and the cluster parameters, such as cluster density and size.
Results. We find that stellar interactions leading to ejections are responsible for up to 20% mass loss in the most compact massive clusters in the Milky Way. Therefore, ejections are the prime mass loss process in these systems. Even in the loosely bound OB associations, stellar interactions are responsible for at least ~5% mass loss. The main reason why the importance of encounters for massive clusters has been largely overlooked is because of the often used approach of a single-mass representation instead of a realistic distribution for the stellar masses. The density dependence on the encounter-induced mass loss is shallower than expected because of the increasing importance of few-body interactions in dense clusters compared to sparse clusters where 2-body encounters dominate.
Key words: open clusters and associations: general / stars: kinematics and dynamics / stars: formation
© ESO, 2013
1. Introduction
Star clusters1 are initially still embedded in the gas and dust from which they are forming. With the conversion from gas and dust to stars being incomplete, the leftover gas/dust component is driven outward by stellar feedback. For embedded clusters containing more than a few hundred stars, this can come in the form of photo-ionizing radiation, the winds of high-mass stars, and the onset of the first supernova explosions (Goodwin 1997).
The subsequent response of the star cluster to the impact of gas expulsion has been the subject of a large number of theoretical investigations (Tutukov 1978; Hills 1980; Lada et al. 1984; Verscheuren & David 1989; Goodwin 1997; Kroupa et al. 1999; Adams 2000; Geyer & Burkert 2001; Kroupa et al. 2001; Boily & Kroupa 2003a,b; Fellhauer & Kroupa 2005; Bastian & Goodwin 2006; Banerjee & Kroupa 2013). Hills (1980) found already that the star formation efficiency ϵSFE of the cluster is a key property in determining the fate of the cluster after gas expulsion. It is defined as the fraction of gas that is converted into stars and is given by  (1)where Mst is the stellar mass and Mgas the gas mass. Later numerical modelling (Lada et al. 1984; Geyer & Burkert 2001; Boily & Kroupa 2003a,b) showed that the actual limit for bound star cluster formation in the case of instantaneous gas loss is in the range of 0.25 <ϵSFE< 0.4.
In the solar neighbourhood the majority of embedded clusters seems not to develop into longer-lived open clusters (Lada & Lada 2003; Porras et al. 2003) but disperses their stars early on (<10 Myr) feeding the field star population. This is largely attributed to the star formation efficiency (SFE) being too low that the cluster could withstand rapid gas loss (Goodwin 2009; Baumgardt & Kroupa 2007). This agrees with observations that find typical SFEs in the solar neighbourhood to lie in the range of 0.1 <ϵSFE< 0.35 (Lada 1999; Lada & Lada 2003). For an alternative explanation for the high cluster infant mortality see Smith et al. (2011).
There are strong indications that the SFE could be higher (≥50%) in starburst clusters, which are preferentially located close to the Galactic centre and in the spiral arms. In these systems infant mortality might be lower and gas expulsion less important (Bastian 2012). Given the large uncertainty in observed SFEs and the strong indications that star formation efficiencies depend on the local gas densities in the molecular cloud (Gutermuth et al. 2011), we cover the entire spectrum from ϵSFE = 0.1 to ϵSFE = 1.0 in the simulations presented here.
Extensive parameter studies of the effect of gas expulsion on massive clusters (N > 104) are rare, as the computational effort is proportional to N2, where N is the number of simulated stars. One noteworthy exception is the parameter study by Baumgardt & Kroupa (2007). To minimize the computational cost, some approximations – namely, the use of a single mass representation for the cluster stars and a profile that is not extremely centrally condensed – are utilized, leading to fewer stellar dynamical interactions.
Apart from the SFE, other factors also determine the bound fraction after gas expulsion. Thus clusters with ϵSFE< 0.3 can still retain bound cluster remnants, if the gas expulsion timescale is long, the cluster concentration high, the initial conditions sub-structured, the initial velocities sub-virial and/or the SFEs radially decreasing (Lada et al. 1984; Goodwin 1997; Adams 2000; Fellhauer & Kroupa 2005; McMillan et al. 2007; Offner et al. 2009; Allison et al. 2011; Smith et al. 2013). In the present study we consider none of these effects, since the aim is to isolate a process that has so far been largely overlooked, or namely, the importance of stellar dynamical interactions.
We show the use of a single-mass representation was one of the main reasons why the importance of dynamical encounters has so far been underestimated. Although there were some first hints that encounters might be important in the development of young clusters (Stahler & Converse 2010; Allison et al. 2010), Moeckel et al. (2012) only recently found that the use of single masses hides the effect of encounters when modelling cluster development after gas expulsion in small N clusters. They attribute the importance of encounters to the smaller ratio of the relaxation to crossing time in small N clusters in comparison to massive clusters. In contrast to the study by Moeckel et al. (2012) we concentrate on massive clusters typically containing >104 stars and perform the first quantitative evaluation of the importance of encounters as a function of the cluster density.
The aim of this paper is to demonstrate that the stellar interaction dynamics plays an important role in the early expansion of typical massive star clusters (>5 × 10³M⊙) of the Milky Way. After describing the numerical method in Sect. 2, it is demonstrated in Sect. 3 why this effect has been largely overlooked in the past. In Sect. 4 the results of the extensive parameter study are presented and summarised by a formula for the bound fraction after gas expulsion, which includes cluster density effects.
2. Method
We use the code Nbody6 (Aarseth 2003) to perform an extensive parameter study of the dynamics of massive star clusters (N > 104) after gas expulsion. For these massive clusters, the gas expulsion timescale is so short that it can be modelled as instantaneous (Fellhauer & Kroupa 2005). Thus, the method described by Goodwin & Bastian (2006) of not explicitly modelling the gas expulsion process itself but using the equivalent supervirial representation at the start of the simulation can be applied here. To test the validity of this approach, we also modelled the full process of gas expulsion on short timescales for a subset of the parameter space, using a temporale-dependent background potential, and found no difference in the results.
Properties of the modelled clusters.
The cluster parameters are chosen in such a way that they span the entire range of properties observed for massive clusters at ages less than 4 Myr in the Milky Way (Pfalzner 2009; Portegies Zwart et al. 2010). In Table 1 the parameter space of our study is detailed. For each of these parameter combinations we model clusters with ϵSFE = 0.1, 0.2, 0.3, 0.4, ..., 1.0.
Using GPU-based computers speeds up the simulations to such an extent that systems with a large stellar membership can be modelled with high statistical significance by averaging over a larger number of cluster representations. The last two columns of Table 1 give the number of realisations and the corresponding standard deviation.
In models P0 and LK0, a single-mass representation for all stars was used. In all other models the stellar masses are distributed according to the initial mass function (IMF) given by Kroupa (2001). The star are spatially distributed, according to a Plummer profile (Plummer 1911) in models P0 and P1 and according to a King profile (W0 = 9; King 1966) in all other models.
Both models were widely used in the past to model young clusters, although they are really only representative of the stellar density distribution in old globular clusters. Comparison with observations show that young clusters are better represented by King models with W0 > 7 (for example, Hillenbrand & Hartmann 1998). In the following, the term, King model, is used as an equivalent to King distributions with high W0 values.
In our simulations, we apply two simplifications to reduce the computational expense; we neglect stellar evolution and start without primordial binaries. These assumptions will be critically discussed in Sect. 6. However, an equally extensive quantitative parameter study that includes these two effects, especially with realistic primordial binary fraction of ≥50%, seems difficult to achieve with current computational facilities. For even the least dense systems including primordial binaries increases the computation time by a factor ~10, for the dense systems (like model CK1) simulations can last easily a factor 100 or even 1000 longer.
Tidal disruption was not included in this study. Apart from clusters located close to the Galactic centre, this effect only plays a significant role at later times than those investigated here.
3. Model dependence
In the following, we want to investigate how the bound fraction after gas expulsion depends on the cluster model used.
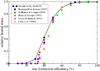 |
Fig. 1 Overview of results from the literature of the relative bound mass as a function of SFE. The solid line represents our results for a cluster with a Plummer distribution of single-mass stars (model P0). |
3.1. Stellar mass representation
Figure 1 summarises the results of previous work by Lada et al. (1984), Geyer & Burkert (2001), Boily & Kroupa (2003a,b), Fellhauer & Kroupa (2005) and Baumgardt & Kroupa (2007). It shows the bound mass fraction as a function of the star formation efficiency. Each of these models exclude encounters between cluster members either explicitly by their simulation method (gravitational softening) or implicitly by using a single mass representation of the stellar population. The general trend in all these simulations is similar: for ϵSFE ≤ 20% the entire cluster basically dissolves, whereas for ϵSFE ~ 30% a remnant cluster remains. However, it contains only ≈5−10% of the initial mass. For higher SFEs, the mass of the remnant cluster increases steeply with the SFE.
Despite the general trend in these results being very similar, some discrepancies are found for SFEs between 20% and 40%. The most likely explanation for these differences is the statistical nature of the results. In the past, clusters with a membership of a few thousand stars were preferentially modelled and simulations were, if at all, repeated only a few times. Figure 1 shows in addition our results of model P1, where we use 30 000 particles and perform 15 simulations per SFE. Due to higher statistical significance the error is only ~0.5%. If we use our error analysis to estimate the error bars in previous simulations, we obtain errors of up to 10%. Thus the differences in Fig. 1 can indeed be largely attributed to statistical fluctuations.
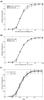 |
Fig. 2 Relative bound mass at 20 Myr as a function of SFE: a) Comparison of cluster models with a Plummer distribution of single stars (model P0 – solid line, squares) and stars chosen according to an IMF (model P1 – dashed line, triangles). b) Comparison between cluster models with a Plummer (model P1 – dashed line, triangles) and a King distribution (model LK1 – solid line, circles. c) Results for model LK1 with 30 000 stars (thick solid line) showing the error bars for results averaged over 15 simulation runs (thin solid line) and the error of a single simulation with 10 000 stars would yield (dotted line). |
We repeated the same type of investigation but used a stellar population according to the IMF of Kroupa (2001) (model P1). Although the general trend is similar, Fig. 2a shows an important difference: for ϵSFE > 70% the simulations with single masses (model P0) show basically no mass loss, whereas the simulation with masses according to the IMF (model P1) show >5% mass loss. This mass loss is due to encounters between cluster members leading to ejections. Obviously even in the case cosidered here, which corresponds to the high-mass end of the relatively wide spread OB associations/loose clusters (see Paper 2), encounters lead to a non-negligible cluster mass loss. We conclude that the often used simplification of modelling the effect of gas expulsion by using single stellar mass models hides this important effect of massive cluster and association dynamics.
3.2. Spatial distribution
Next, we investigate to what extent the chosen cluster profile influences the result. In Fig. 2b the dashed line shows the results for Plummer-distributed clusters (model P1), whereas the drawn line denotes King-type clusters (model LK1). All other model parameters are the same. The general trend is again very similar, even the loss caused by stellar interactions is nearly as high in the case of a Plummer-type cluster as for a King profile. For ϵSFE = 0.3, the bound mass for Plummer-type clusters is, however, only about half that of King-type clusters. The reason is that Plummer profiles show a much lower concentration of stars in the cluster centre. When a cluster expands as a response to gas expulsion, mass loss occurs predominantly from outside inwards. Consequently, the remnant cluster mass is higher as in King-shaped clusters more mass is concentrated in the central regions. This effect is most pronounced for SFEs where the remnant cluster basically consists of the former inner core of the cluster, which is the case for ~30% SFE.
3.3. Statistical significance
One reason why the significance of encounters and the influence of the cluster profile in the 30% SFE range was underestimated in the past is that often only a small sample of simulations was considered. Figure 2c shows the error considering a single 10 000 star simulation, a single 30 000 star simulation and the average over 15 simulations of clusters containing 30 000 stars.
For a single simulation with 10 000 stars it would be equally likely to conclude that one would obtain no mass loss or a 15% mass loss for a 100% SFE case. Equally, these large errors allow a bound fraction of 2−20% for the case of ϵSFE = 0.3. The above considered effects can thus easily hide within the statistical bandwidth. Performing 15 realisations of a 30 000 star cluster model reduces the error to 2−3%. Only with this small error is it possible to detect the 5−10% mass loss due to encounters in this type of cluster and to show that Plummer-profiles give smaller bound fractions than King-shaped clusters for intermediate SFEs.
For quantitative results with errors <3%, one needs to follow at least 500 000 stars over the course of a set of simulations. We achieved this accuracy for all investigated parameters, except for simulations of extreme dense clusters (models CK1 – CK4). Here, the density that is ~1000 times higher leads to much longer computation times due to the high number of close encounter. In addition, the number of simulations that stop before 20 Myr due to numerical problems also increases.
One might wonder why the error for model LK1 is about 2−3% (Fig. 2c) whereas the error for model P1 is <1%. The reason is the presence of encounters in model LK1. The occurrence of encounters is strongly determined by the statistical fluctuations in the special distribution of the cluster members, which depend on the details of the upper end of the mass spectrum and the number and nature of binaries present.
We find that mostly low-mass stars are ejected. This also holds in relative terms: Ejections are responsible for ~6% mass loss from all stars but only 2% for B-type stars in model LK1.
4. The influence of cluster density
Naturally, the role played by encounters is a function of cluster density. Figure 3 shows the bound mass fraction 20 Myr after gas expulsion as a function of the SFE for 15 000, 30 000, and 45 000 stars (models LK4, LK1, and LK3). As each model has the same half-mass radius of rhm = 1.3 pc, the stellar density in model LK3 is 3 times higher than in model LK4. Nevertheless, the results are basically the same considering the error of 2−3%.
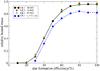 |
Fig. 3 The bound mass fraction after 20 Myr as a function of the SFE. The different symbols indicate the different cluster models as detailed in Table 1. |
Only for 30% SFE, the result for the less dense model, LK4 shows a slightly higher bound mass fraction than the denser models, LK1 and LK3. The reason is not, as one might expect, the lower density in model LK4 but the longer crossing and relaxation time in the lower density cluster. System LK4 has not yet reached its new equilibrium state at 20 Myr (see Parmentier & Baumgardt 2012). Looking at later times, this confirms that the bound mass fraction is then basically the same as in models LK1 and LK3, although it takes longer for model LK4 to reach the new equilibrium state. A factor of three in density does not change the results in a perceivable way.
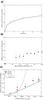 |
Fig. 4 Relative mass loss induced by stellar encounters a) as a function of time for model CK1 for the case of ϵSFE = 1.0; b) as function of the SFE for model CK1; and c) as a function of the initial cluster density. In b), no data points for SFEs of 10% and 20% are plotted, as the bound masses here are so low and the errors are large, such that no meaningful values for the differences can be obtained. In c) the different symbols give the values obtained from the simulation results for ϵSFE = 0.3 (circle), ϵSFE = 0.7 (square), and ϵSFE = 1.0 (triangle). The curve shows the approximation of (log (ρ))3/2. |
Only if one goes to much denser clusters as in model CK1, the dependence on the cluster density becomes apparent. The much smaller half-mass radius of rhm = 0.1 pc means a stellar density that is ~2000 times higher. Naturally, encounters become much more important in such an extremely dense environment.
First, we compare the hypothetical case of 100% SFE, which allows to study the impact of encounters without the gas expulsion process. Figure 4a shows that the mass loss for 100% SFE, completely due to encounter, is ~18% after 20 Myr of cluster development. This loss is not instantaneous but proceeds over the entire shown time span of 20 Myr (see Fig. 4a) and continues to some extend even afterwards. The steady but slow mass loss due to stellar interactions means that the cluster has enough time to respond by expanding until it reaches a new equilibrium state.
The mass loss due to stellar interactions is most pronounced during the first 3 Myr and decreases over time (see Fig. 4a). The reason is that the cluster CK 1 expands by approximately a factor 9 over 20 Myr for ϵSFE = 1.0 leading to a decrease in cluster density by a factor of ~700. Thus, stellar interactions become rarer with time.
For lower SFEs, gas expulsion leads to rapid cluster expansion and a fast decrease in cluster density. Therefore, one would expect a reduced effect of encounters and one could indeed interpret Fig. 4b in this way. It shows the mass loss due to stellar interactions as the function of the SFE. However, the error is large for small SFEs because of the small number of stars in the remnant cluster. Thus, the data could as well be interpreted as being constant. For simplicity we use this interpretation for the remainder of this investigation.
Using different initial cluster radii (models LK2, CK2, CK3, and CK4) and performing the equivalent set of simulations, we determine the dependence of the relative mass loss due to stellar encounters on the initial cluster density. This is easiest for ϵSFE = 1.0, where the mass loss is solely due to stellar encounters. However, both mass loss processes can be separated as well for lower SFEs by subtraction from a very low density case. Figure 4c shows that the relative mass loss due to stellar interactions is a weak function of the initial stellar density. This means that one needs at least a factor of 100 in the difference of density to detect this density dependence, given the large statistical scatter of the results. A fit formula for the bound mass fraction after 20 Myr as a function of the SFE that includes its density dependence is given in the Appendix.
5. Nature of the encounter-induced mass loss
This weak density dependence is surprising; according to classical theory, one would attribute the mass loss due to encounters to 2-body relaxation processes. In this picture, the rate of loss is given as (Binney & Tremaine 2008) 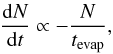 (2)where the evaporation tevap is a multiple of the relaxation time trelax, which in turn is proportional to the crossing time tcross. In Fig. 4c, all investigated clusters are of the same mass; therefore, it would follow for the relative mass loss through 2-body relaxation (ΔM/M)2 - body:
 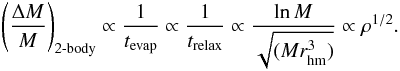 (3)In Fig. 4c this ρ1/2-dependence is plotted as dashed line. It can be seen that classical theory based on 2-body relaxation processes predicts a much stronger dependence on the cluster density for very dense clusters than found in the simulations. One could now anticipate that the fraction of formed binaries or the degree of mass segregation is possibly responsible for this deviation from the 2-body relaxation approach.
Although all these processes might influence the result to some degree, we find that a change in the nature of the encounter dynamics at very high densities is the main reason for the observed discrepancy. This change was already noticed in the context of the influence of encounters on protoplanetary discs (Olczak et al. 2010; Duke & Krumholz 2012; Olczak et al. 2012; Pfalzner 2013). It was found there that parabolic encounters with low-mass stars (<0.5 M⊙) and the few most massive stars of the system dominate at mean cluster densities of ≈103 pc-3. We find a similar transition in our simulations for the encounter induced mass loss in the gas expulsion phase.
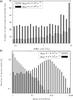 |
Fig. 5 a) Average number of encounters each star has before it becomes ejected as a function of stellar mass. The grey indicates clusters with ρ = 1 × 10³ pc-3 and black clusters with ρ = 4 × 10⁴ pc-3. b) For all stars that become ejected, their mean eccentricity in the encounters that eventually lead them to become unbound. |
To pin down the reason for this effect without the difficulty of the density changing during the simulation, we re-analysed our results described in Olzak et al. (2010), where the cluster density is relatively constant. We found that the number of encounters per star before ejection increases compared to lower mass clusters (see Fig. 5a) although the relative number of ejected stars increases in dense clusters at the same time. In contrast to low-density clusters where most encounters are on parabolic orbits, highly hyperbolic encounters with the eccentricities (e ≫ 10) (see Fig. 5b) dominate in dense clusters.
The reason for the dominance of hyperbolic encounters in very dense clusters is that there the density becomes so high that any encounter between two stars is to some degree perturbed by the remainder of the cluster. This means that the approximation of 2-body relaxation becomes invalid and replaced by few-body encounters. These few-body interactions are not necessarily encounters between a single star and a binary or higher order systems but includes groups of unbound stars as well.
The resulting hyperbolic orbits are much less efficient in producing escapers than the equivalent parabolic 2-body encounters. Therefore, it follows that  (4)where
  is the few-body relaxation time. The transition from predominately 2-body encounters to few-body encounters in very dense clusters is thus the reason for the weaker than expected dependence on the cluster density of the encounter-induced mass loss.
From the above simulations it is difficult to pinpoint an exact cluster density where this transition to a few-body encounter dominated system happens. Due to the gas expulsion process, the cluster density changes rapidly with cluster age. From our simulations described in Olczak et al. (2010), we can, however, give a first estimate that the transition from 2-body to few body dominated encounters happens for mean cluster densities of ≈104 pc-3. The encounters that lead to ejections mainly take place in the central cluster areas, where the density is 10 to 100 times higher than this average.
Taking the above estimate as a guide for the investigated sample here, there are three modes of cluster development: 2-body dominated clusters (model LK2), clusters that are initially few-body dominated but become 2-body dominated in the expulsion phase (model LK0), and models that largely stay in the few-body dominated regime throughout (model CK1). The latter mode explains as well the weak dependence of the encounter-induced mass loss on the SFE, despite the strong dependence of the expansion history on the SFE.
6. Discussion
In the present parameter study, we made several commonly used approximations: gas expulsion was assumed to be instantaneous, and no sub-structuring or primordial mass segregation. Stellar evolution was not considered, and the simulations contained no primordial binaries. The first two assumptions, instantaneous gas expulsion and no sub-clustering, are probably justified for the high-mass cluster considered here. The large number of massive stars should lead to rapid gas expulsion, and sub-structuring caused by the star formation process is probably quickly removed.
Mass segregation can only change the encounter-induced mass loss when gravitational focussing plays a role. Therefore, the results of the dense end of our sample should not be affected. For the less dense clusters, it is actually the non-mass segregated clusters that lead to more encounter-induced loss. Here well-separated stars lead to multiple gravitational foci, whereas only one gravitational focus exists in mass-segregated clusters.
Including stellar evolution in the simulations would lead to some additional mass loss. However, this additional mass loss would not set in for some time after gas expulsion. Depending on the actual massive star composition of the considered cluster, it will take a few Myr until the first star would explode as supernova. However, it is during these first few Myr when mass loss by gas expulsion and stellar interactions is most pronounced. For example, a cluster with ϵSFE = 0.3 has completed ~90% of its total mass loss at 5 Myr due to gas expulsion and <55% of the mass loss due to stellar interactions. For the example of our model clusters LK1 (initial mass ≈18 000 M⊙), the mass loss due to gas expulsion is ~16 000 M⊙ and to encounters 500 M⊙. In comparison the mass loss due to the explosion of a single supernova is at most 150 M⊙. Then, the general conclusions of this paper will still hold if stellar evolution is included. If one includes stellar evolution, the bound cluster mass will continue to decline, also slowly, at times >20 Myr. As a result the expansion will proceed but to a much lesser degree than during the first 20 Myr of the cluster development.
Neglecting primordial binaries could have more severe consequences. Unlike stellar evolution it influences the stellar dynamics right from the start. Although binaries form very quickly by capture processes in above simulation, the binary properties do not correspond to those of a primordial binary population. Simulations of ONC-like clusters, show that although capture processes lead to ~20% of binaries, however, they largely miss the very tight binary population with periastra smaller than 100 AU (Pfalzner & Olczak 2007). Here, we find that in the clusters with ρ = 1 × 10³ pc-4 about ~50% of the ejected stars have been at some point part of a binary, whereas for denser clusters only ~30% have been part of a binary.
Energetic three-body interactions lead to ejections from the cluster and the connected mass loss. As close binaries are under-represented in above simulations, ejections should be even more common in real clusters. Performing a similar parameter study including binaries would be computationally very time consuming, especially for the densest systems. Therefore, we only performed the same kind of analysis for model LK1 with 30% initial binaries. In this case, the mass loss due to encounters was 11% compared to ~6% without primordial binaries. The situation might be different in the densest systems (model CK 1), where the higher densities might possibly favour rapid tight binary formation. This will require further investigation.
We showed that higher cluster concentrations (here Plummer vs. King W0 = 9) lead to considerably higher mass remnant clusters if the SFE is in the range 0.2 <ϵSFE< 0.4. Currently the cluster profile at the onset of gas expulsion is observationally poorly restrained. As for these SFEs the outcome of gas expulsion seems so sensitive to the inner profile, it would highly desirable to obtain better guidance here from observations of massive clusters like, for example, Cyg OB2.
Here, we assumed that the SFE throughout the cluster is constant. However, it has been argued that the SFE could be a function of the gas density or surface density with higher gas densities leading to higher SFEs (Adams 2000; Parmentier & Pfalzner 2013). For a cluster environment, this would result in a higher SFE in the cluster centre than at the outskirts. For the gas expulsion process this means a stronger binding of the central part and a higher bound fraction. In terms of the importance of stellar interactions, the higher central density compared to the constant SFE case leads to more interactions and mass loss due to stellar interactions should increase.
If one considers lower mass clusters, the assumption of instantaneous gas expulsion and no sub-structuring are more critical. Lower mass clusters of the same size as their high-mass counterparts have lower stellar densities and one would expect that stellar interactions are much less important. However, gas expulsion probably takes much longer in clusters of lower mass (<103M⊙), because they contain fewer, if any, massive stars driving the gas expulsion process. This results in slower cluster expansion leading to a slower decrease in cluster density and the cluster having more time to experience stellar interactions. Previous work showed that sub-structured initial conditions can lead to more massive remnant clusters. In lower mass clusters sub-structuring, locally enhanced densities leading to more stellar interactions thus remains an issue for much longer times. Future investigations should address the relative importance of these two issues.
We start here after gas expulsion has finished; however, the conditions in the cluster are probably very sensitive to what happened in the pre-gas expulsion phase. A self-consistent treatment of these two phase would be the essential next step.
7. Conclusion
An extensive numerical parameter study of the bound cluster mass after gas expulsion as a function of the star formation was performed, which largely confirms the qualitative results of previous work. However, what distinguishes the results presented here is that it includes stellar interactions in a realistic way and shows the dependence of the bound fraction on the cluster density. This cluster density dependence is caused by additional mass loss due to ejections caused by stellar interactions between cluster members.
The reason why the effect of stellar interactions has been overlooked in the past, lies in a combination of the chosen cluster models and relatively large errors due to low sample sizes in the numerical simulations. Due to our large sample size, this is the first quantitative description with an accuracy of ~3%. However, the most severe influence has the often chosen single-mass representation of the stellar population instead of the full stellar mass spectrum present in a real cluster. In these models, strong stellar interactions are generally under-represented and effects like gravitational focussing (Pfalzner et al. 2006) are completely absent.
Our results show that encounters alone can lead to mass loss of up to 20% of the total cluster mass for the densest clusters typical in the Milky Way like the Arches cluster. Even in less dense massive OB associations, 5% of the initial cluster mass is lost due to stellar interactions.
The results of this numerical study are summarised in a simple fit formula (given in the appendix) for the bound mass fraction as a function of the SFE and the cluster density. This density dependence is shallower than one would expect from 2-body relaxation processes because few-body interaction become important at cluster densities above 104M⊙.
In this study, no primordial binaries were included. This means that the values of mass loss by ejection given here are actually lower limits and could be even higher. We will address this problem in the near future.
Acknowledgments
We would like to thank the referee for the very constructive comments. Part of the simulations were performed at FZ Jülich under project number HKU14.
References
- Aarseth, S. J. 2003, Gravitational N-Body Simulations (Cambridge, UK: Cambridge University Press), 430 [Google Scholar]
- Adams, F. C. 2000, ApJ, 542, 964 [NASA ADS] [CrossRef] [Google Scholar]
- Allison, R. J. 2012, MNRAS, 421, 3338 [NASA ADS] [CrossRef] [Google Scholar]
- Allison, R. J., Goodwin, S. P., Parker, R. J., Portegies Zwart, S. F., & de Grijs, R. 2010, MNRAS, 407, 1098 [Google Scholar]
- Banerjee, S., & Kroupa, P. 2013, ApJ, 764, 29 [NASA ADS] [CrossRef] [Google Scholar]
- Bastian, N. 2011, Stellar Clusters & Associations: A RIA Workshop on Gaia, 85 [Google Scholar]
- Bastian, N., & Goodwin, S. P. 2006, MNRAS, 369, L9 [NASA ADS] [CrossRef] [Google Scholar]
- Baumgardt, H., & Kroupa, P. 2007, MNRAS, 380, 1589 [NASA ADS] [CrossRef] [Google Scholar]
- Binney, J., & Tremaine, S. 2008, Galactic Dynamics (Princeton, USA: Princeton University Press) [Google Scholar]
- Boily, C. M., & Kroupa, P. 2003a, MNRAS, 338, 673 [NASA ADS] [CrossRef] [Google Scholar]
- Boily, C. M., & Kroupa, P. 2003b, MNRAS, 338, 665 [NASA ADS] [CrossRef] [Google Scholar]
- Clark, P. C., & Bonnell, I. A. 2004, MNRAS, 347, L36 [NASA ADS] [CrossRef] [Google Scholar]
- Converse, J. M., & Stahler, S. W. 2010, MNRAS, 405, 666 [NASA ADS] [Google Scholar]
- Dukes, D., & Krumholz, M. R. 2012, ApJ, 754, 56 [NASA ADS] [CrossRef] [Google Scholar]
- Fellhauer, M., & Kroupa, P. 2005, ApJ, 630, 879 [NASA ADS] [CrossRef] [Google Scholar]
- Geyer, M. P., & Burkert, A. 2001, MNRAS, 323, 988 [NASA ADS] [CrossRef] [Google Scholar]
- Goodwin, S. P. 1997, MNRAS, 284, 785 [NASA ADS] [CrossRef] [Google Scholar]
- Goodwin, S. P. 2009, Ap&SS, 324, 259 [NASA ADS] [CrossRef] [Google Scholar]
- Goodwin, S. P., & Bastian, N. 2006, MNRAS, 373, 752 [NASA ADS] [CrossRef] [Google Scholar]
- Gutermuth, R. A., Pipher, J. L., Megeath, S. T., et al. 2011, ApJ, 739, 84 [NASA ADS] [CrossRef] [Google Scholar]
- Hillenbrand, L. A., & Hartmann, L. W. 1998, ApJ, 492, 540 [NASA ADS] [CrossRef] [Google Scholar]
- Hills, J. G. 1980, ApJ, 235, 986 [NASA ADS] [CrossRef] [Google Scholar]
- King, I. R. 1966, AJ, 71, 64 [Google Scholar]
- Kroupa, P., Petr, M. G., & McCaughrean, M. J. 1999, New A, 4, 495 [NASA ADS] [CrossRef] [Google Scholar]
- Kroupa, P., Aarseth, S., & Hurley, J. 2001, MNRAS, 321, 699 [NASA ADS] [CrossRef] [Google Scholar]
- Lada, C. J., & Lada, E. A. 2003, ARA&A, 41, 57 [NASA ADS] [CrossRef] [Google Scholar]
- Lada, C. J., Margulis, M., & Dearborn, D. 1984, ApJ, 285, 141 [NASA ADS] [CrossRef] [Google Scholar]
- Lüghausen, F., Parmentier, G., Pflamm-Altenburg, J., & Kroupa, P. 2012, MNRAS, 423, 1985 [NASA ADS] [CrossRef] [Google Scholar]
- Mathieu, R. D. 1983, ApJ, 267, L97 [NASA ADS] [CrossRef] [Google Scholar]
- McMillan, S. L. W., Vesperini, E., & Portegies Zwart, S. F. 2007, ApJ, 655, L45 [NASA ADS] [CrossRef] [Google Scholar]
- Moeckel, N., Holland, C., Clarke, C. J., & Bonnell, I. A. 2012, MNRAS, 425, 450 [NASA ADS] [CrossRef] [Google Scholar]
- Offner, S. S. R., Hansen, C. E., & Krumholz, M. R. 2009, ApJ, 704, L124 [NASA ADS] [CrossRef] [Google Scholar]
- Olczak, C., Pfalzner, S., & Eckart, A. 2010, A&A, 509, A63 [NASA ADS] [CrossRef] [EDP Sciences] [Google Scholar]
- Olczak, C., Kaczmarek, T., Harfst, S., Pfalzner, S., & Portegies Zwart, S. 2012, ApJ, 756, 123 [NASA ADS] [CrossRef] [Google Scholar]
- Parmentier, G., & Pfalzner, S. 2013, A&A, 549, A132 [NASA ADS] [CrossRef] [EDP Sciences] [Google Scholar]
- Pfalzner, S. 2009, A&A, 498, L37 [NASA ADS] [CrossRef] [EDP Sciences] [Google Scholar]
- Pfalzner, S. 2011, A&A, 536, A90 [NASA ADS] [CrossRef] [EDP Sciences] [Google Scholar]
- Pfalzner, S. 2013, A&A, 549, A82 [NASA ADS] [CrossRef] [EDP Sciences] [Google Scholar]
- Pfalzner, S., & Olczak, C. 2007, A&A, 475, 875 [NASA ADS] [CrossRef] [EDP Sciences] [Google Scholar]
- Pfalzner, S., Olczak, C., & Eckart, A. 2006, A&A, 454, 811 [NASA ADS] [CrossRef] [EDP Sciences] [Google Scholar]
- Plummer, H. C. 1911, MNRAS, 71, 460 [CrossRef] [Google Scholar]
- Porras, A., Christopher, M., Allen, L., et al. 2003, AJ, 126, 1916 [NASA ADS] [CrossRef] [Google Scholar]
- Portegies Zwart, S. F., McMillan, S. L. W., & Gieles, M. 2010, ARA&A, 48, 431 [NASA ADS] [CrossRef] [Google Scholar]
- Proszkow, E.-M., Adams, F. C., Hartmann, L. W., & Tobin, J. J. 2009, ApJ, 697, 1020 [NASA ADS] [CrossRef] [Google Scholar]
- Smith, R., Fellhauer, M., Goodwin, S., & Assmann, P. 2011, MNRAS, 414, 3036 [NASA ADS] [CrossRef] [Google Scholar]
- Smith, R., Goodwin, S., Fellhauer, M., & Assmann, P. 2013, MNRAS, 428, 1303 [NASA ADS] [CrossRef] [Google Scholar]
- Tutukov, A. V. 1978, A&A, 70, 57 [NASA ADS] [Google Scholar]
- Verschueren, W., & David, M. 1989, A&A, 219, 105 [NASA ADS] [Google Scholar]
- Whitmore, B. C., Zhang, Q., Leitherer, C., et al. 1999, AJ, 118, 1551 [NASA ADS] [CrossRef] [Google Scholar]
Appendix A: Fit formula for the bound fraction including density dependence
In an accompanying paper (Pfalzner & Kaczmarek, in prep.), we show how the effect of gas expulsion can be directly compared to observation for clusters more massive than 104M⊙. A fit formula for the total relative bound mass as a function of SFE and density is useful there. Here, presented results can be approximated by ![\appendix \setcounter{section}{1} \begin{eqnarray} \left( \frac{M_{\rm b}}{M_{\rm in}} \right) = 0.5 \left(1-0.7\arctan \left[ 12 (\epsilon_{\rm SFE}-0.42) \right] \right) - \left[\log(\rho)\right]^{3/2}, \nonumber\\. \end{eqnarray}](/articles/aa/full_html/2013/07/aa21362-13/aa21362-13-eq48.png) (A.1)where the first term is the mass loss solely due to gas expulsion and the second term is that due to encounter. If the cluster density is so low that stellar encounters play no role (for clusters with ρ0 < 10 M⊙ pc-3), the mass loss can be approximated by just using the first term.
(A.1)where the first term is the mass loss solely due to gas expulsion and the second term is that due to encounter. If the cluster density is so low that stellar encounters play no role (for clusters with ρ0 < 10 M⊙ pc-3), the mass loss can be approximated by just using the first term.
A comparison between the numerical results for models LK1 (open circles) and CK1(filled diamonds) with the corresponding approximations is shown in Fig. A.1. Figure A.1 includes a comparison between the numerical results for low density clusters (filled triangles) with this approximation (dashed line). The mean error of the fit formula compared to the numerical results is usually smaller than the numerical error. The exception is ϵSFE = 0.5, where the approximation gives a value that is 6.5% smaller than the numerical result.
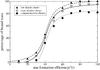 |
Fig. A.1 The bound mass fraction after 20 Myr as a function of the SFE. The results from model LK1 are represented by circles and those of model CK1 by diamonds. Here the fits according to Eq. (A1) (represented as lines) and the numerical values (represented by the symbols) are shown for low-density clusters (dashed line, triangles), OB/leaky clusters (drawn line, circles), and starburst clusters (dotted line, diamonds). |
All Tables
All Figures
|
Fig. 1 Overview of results from the literature of the relative bound mass as a function of SFE. The solid line represents our results for a cluster with a Plummer distribution of single-mass stars (model P0). |
| In the text | |
|
Fig. 2 Relative bound mass at 20 Myr as a function of SFE: a) Comparison of cluster models with a Plummer distribution of single stars (model P0 – solid line, squares) and stars chosen according to an IMF (model P1 – dashed line, triangles). b) Comparison between cluster models with a Plummer (model P1 – dashed line, triangles) and a King distribution (model LK1 – solid line, circles. c) Results for model LK1 with 30 000 stars (thick solid line) showing the error bars for results averaged over 15 simulation runs (thin solid line) and the error of a single simulation with 10 000 stars would yield (dotted line). |
| In the text | |
|
Fig. 3 The bound mass fraction after 20 Myr as a function of the SFE. The different symbols indicate the different cluster models as detailed in Table 1. |
| In the text | |
|
Fig. 4 Relative mass loss induced by stellar encounters a) as a function of time for model CK1 for the case of ϵSFE = 1.0; b) as function of the SFE for model CK1; and c) as a function of the initial cluster density. In b), no data points for SFEs of 10% and 20% are plotted, as the bound masses here are so low and the errors are large, such that no meaningful values for the differences can be obtained. In c) the different symbols give the values obtained from the simulation results for ϵSFE = 0.3 (circle), ϵSFE = 0.7 (square), and ϵSFE = 1.0 (triangle). The curve shows the approximation of (log (ρ))3/2. |
| In the text | |
|
Fig. 5 a) Average number of encounters each star has before it becomes ejected as a function of stellar mass. The grey indicates clusters with ρ = 1 × 10³ pc-3 and black clusters with ρ = 4 × 10⁴ pc-3. b) For all stars that become ejected, their mean eccentricity in the encounters that eventually lead them to become unbound. |
| In the text | |
|
Fig. A.1 The bound mass fraction after 20 Myr as a function of the SFE. The results from model LK1 are represented by circles and those of model CK1 by diamonds. Here the fits according to Eq. (A1) (represented as lines) and the numerical values (represented by the symbols) are shown for low-density clusters (dashed line, triangles), OB/leaky clusters (drawn line, circles), and starburst clusters (dotted line, diamonds). |
| In the text | |
Current usage metrics show cumulative count of Article Views (full-text article views including HTML views, PDF and ePub downloads, according to the available data) and Abstracts Views on Vision4Press platform.
Data correspond to usage on the plateform after 2015. The current usage metrics is available 48-96 hours after online publication and is updated daily on week days.
Initial download of the metrics may take a while.