Fig. A.1
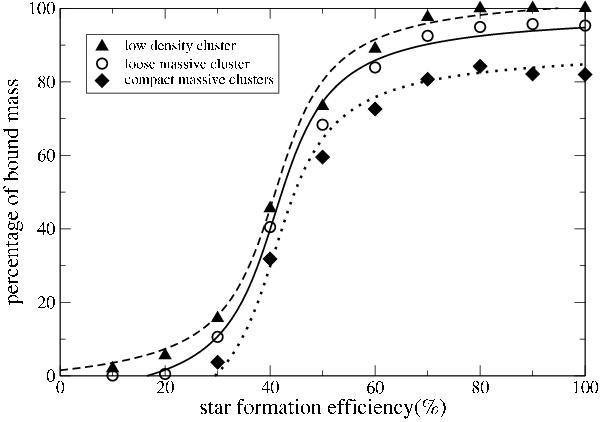
The bound mass fraction after 20 Myr as a function of the SFE. The results from model LK1 are represented by circles and those of model CK1 by diamonds. Here the fits according to Eq. (A1) (represented as lines) and the numerical values (represented by the symbols) are shown for low-density clusters (dashed line, triangles), OB/leaky clusters (drawn line, circles), and starburst clusters (dotted line, diamonds).
Current usage metrics show cumulative count of Article Views (full-text article views including HTML views, PDF and ePub downloads, according to the available data) and Abstracts Views on Vision4Press platform.
Data correspond to usage on the plateform after 2015. The current usage metrics is available 48-96 hours after online publication and is updated daily on week days.
Initial download of the metrics may take a while.