Fig. 2
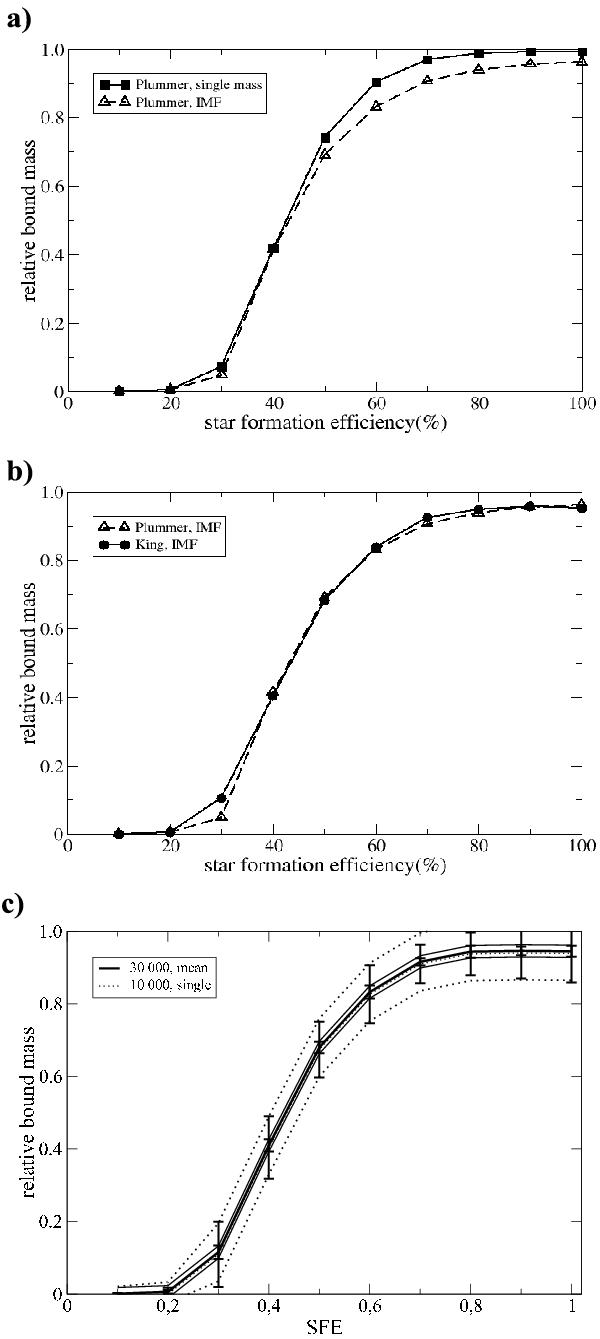
Relative bound mass at 20 Myr as a function of SFE: a) Comparison of cluster models with a Plummer distribution of single stars (model P0 – solid line, squares) and stars chosen according to an IMF (model P1 – dashed line, triangles). b) Comparison between cluster models with a Plummer (model P1 – dashed line, triangles) and a King distribution (model LK1 – solid line, circles. c) Results for model LK1 with 30 000 stars (thick solid line) showing the error bars for results averaged over 15 simulation runs (thin solid line) and the error of a single simulation with 10 000 stars would yield (dotted line).
Current usage metrics show cumulative count of Article Views (full-text article views including HTML views, PDF and ePub downloads, according to the available data) and Abstracts Views on Vision4Press platform.
Data correspond to usage on the plateform after 2015. The current usage metrics is available 48-96 hours after online publication and is updated daily on week days.
Initial download of the metrics may take a while.