Fig. 4
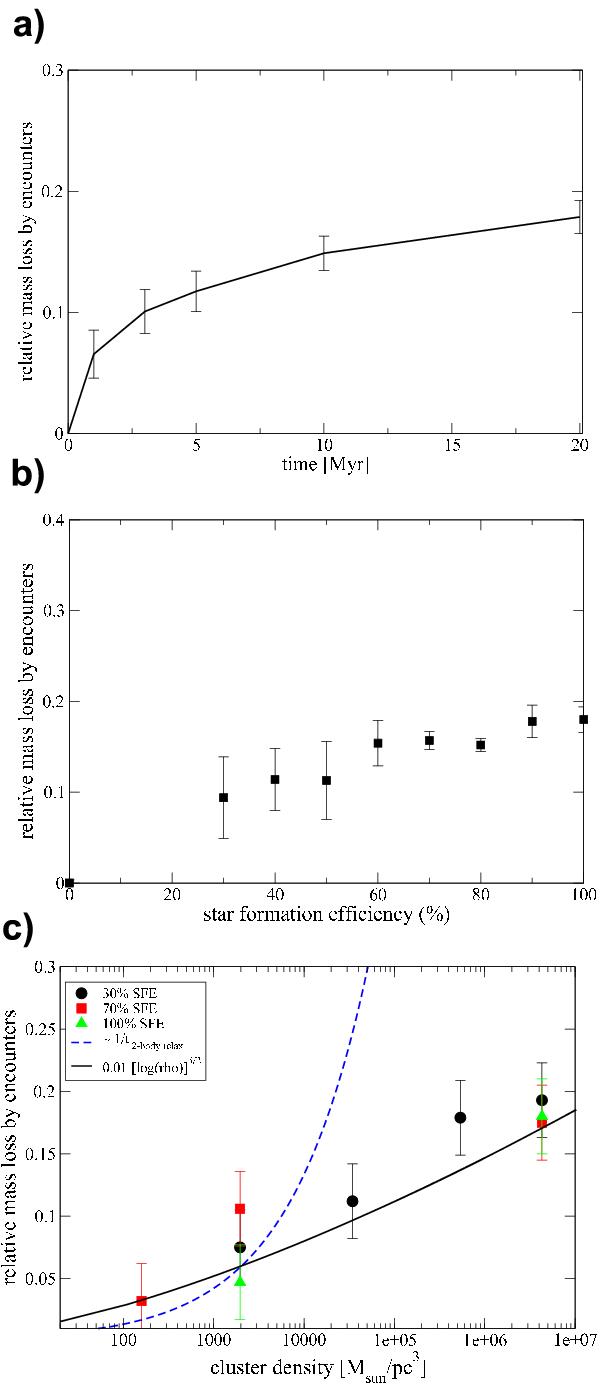
Relative mass loss induced by stellar encounters a) as a function of time for model CK1 for the case of ϵSFE = 1.0; b) as function of the SFE for model CK1; and c) as a function of the initial cluster density. In b), no data points for SFEs of 10% and 20% are plotted, as the bound masses here are so low and the errors are large, such that no meaningful values for the differences can be obtained. In c) the different symbols give the values obtained from the simulation results for ϵSFE = 0.3 (circle), ϵSFE = 0.7 (square), and ϵSFE = 1.0 (triangle). The curve shows the approximation of (log (ρ))3/2.
Current usage metrics show cumulative count of Article Views (full-text article views including HTML views, PDF and ePub downloads, according to the available data) and Abstracts Views on Vision4Press platform.
Data correspond to usage on the plateform after 2015. The current usage metrics is available 48-96 hours after online publication and is updated daily on week days.
Initial download of the metrics may take a while.