| Issue |
A&A
Volume 554, June 2013
|
|
|---|---|---|
| Article Number | A37 | |
| Number of page(s) | 5 | |
| Section | Astrophysical processes | |
| DOI | https://doi.org/10.1051/0004-6361/201321305 | |
| Published online | 31 May 2013 | |
Footprints in the wind of Vela X–1 traced with MAXI⋆
1 Institut für Astronomie und Astrophysik, Sand 1, 72076 Tübingen, Germany
e-mail: This email address is being protected from spambots. You need JavaScript enabled to view it.
2 MAXI team, RIKEN, 2-1 Hirosawa, Wako, 351-0198 Saitama, Japan
3 School of Dentistry at Matsudo, Nihon University, 2-870-1, Sakaecho-nishi, Matsudo, 271-8587 Chiba, Japan
4 ISS Science Project Office, Institute of Space and Astronautical Science (ISAS), Japan Aerospace Exploration Agency (JAXA), 2-1-1 Sengen, Tsukuba, 305-8505 Ibaraki, Japan
5 Department of Physics, The University of Tokyo 7-3-1 Hongo, Bunkyo-ku, 113-0033 Tokyo, Japan
Received: 16 February 2013
Accepted: 21 April 2013
Abstract
The stellar wind around a compact object in luminous wind-accreting high-mass X-ray binaries is expected to be strongly ionized with the X-rays coming from the compact object. The stellar wind of hot stars is mostly driven by light absorption in lines of heavier elements, and X-ray photo-ionization significantly reduces the radiative force within the so-called Strömgren region, leading to wind stagnation around the compact object. In close binaries like Vela X−1 this effect might alter the wind structure throughout the system. Using the spectral data from the Monitor of All-sky X-ray Image (MAXI), we studied the observed dependence of the photoelectric absorption as a function of the orbital phase in Vela X−1 and found that it is inconsistent with expectations for a spherically symmetric smooth wind. Taking into account previous investigations, we developed a simple model for wind structure with a stream-like photoionization wake region of slower and denser wind trailing the neutron star, which is responsible for the observed absorption curve.
Key words: binaries: eclipsing / X-rays: binaries / pulsars: individual: Vela X-1
The movie associated to Fig. 3 is available in electronic form at http://www.aanda.org
© ESO, 2013
1. Introduction
Vela X−1 is a persistently active high-mass X-ray binary system consisting of a massive neutron star (1.88 M⊙, Quaintrell et al. 2003) and the B0.5Ib-type supergiant HD 77581 with a mass of ~23 M⊙ and radius of ~30 R⊙ (van Kerkwijk et al. 1995). The hot primary loses mass at a rate of ~10-6 M⊙ yr-1 (Nagase et al. 1986) through a powerful stellar wind, which is accreted onto the neutron star located ~ 53 R⊙ away, and powers the X-ray pulsar. The pulsar is eclipsed by the primary during every orbital cycle of ~8.964 d (van Kerkwijk et al. 1995). The spin period of the neutron star, Ps ~ 283.5 s (Rappaport 1975), has remained almost constant since this discovery. The X-ray spectrum of Vela X−1 is typical for accreting pulsars, and is well described by a cutoff power law (Nagase et al. 1986) with cyclotron resonance scattering features at ~25 (Makishima & Mihara 1992) and ~ 50 − 55 keV (Kendziorra et al. 1992; Makishima et al. 1999). Similar to other wind-accreting systems, the X-ray flux in Vela X−1 is strongly variable and may change by orders of magnitude within minutes (Kreykenbohm et al. 2008; Doroshenko et al. 2011). The variability is usually associated with the clumpy nature of the captured radiatively driven wind (Oskinova et al. 2007; Fürst et al. 2010). The observed average X-ray flux implies a luminosity of ~4 × 1036 erg s-1 (assuming a distance of ~2 kpc, Nagase 1989), which agrees with the estimate for Bondy-Hoyle accretion from smooth spherically symmetric wind with an observed terminal velocity of ~1100 km s-1 (Watanabe et al. 2006), and a mass-loss rate of ~10-6 M⊙ yr-1. The wind in Vela X−1, however, is not expected to be symmetric, and the X-ray emission from the pulsar is supposed to ionize the wind almost down to the surface of the primary, leading to wind stagnation and formation of the photoionization wake trailing the neutron star (Blondin et al. 1990; Feldmeier et al. 1996). Similar studies were also performed for other sources (Manousakis et al. 2012). More recently, detailed calculations of wind acceleration in the presence of an X-ray source have been carried out by Krtička et al. (2012) with application to Vela X−1 for the stationary case. The authors found that the wind velocity field is significantly affected by the feedback from the accreting neutron star and anticipated an almost complete stagnation of the wind within the “photoionization-bubble” around the neutron star.
Several studies point to the existence of such a feature in Vela X−1. Nagase et al. (1986) observed strong asymmetry between the ingress and egress of the eclipse, accompained by increase in energy of Fe-K line and the absorption edge, which Feldmeier et al. (1996) interpreted as enhanced scattering of X-rays in the denser region, trailing the neutron star. Based on the large observed size of the scattering region, these authors ruled out the accretion wake in favor of the photoionization wake as the scattering site.
Based on the orbital modulation of the UV-resonance lines in several systems, including Vela X−1, van Loon et al. (2001) concluded that a complex wind structure with an ionized region around and a photoionization wake behind the neutron star is required to explain the high-resolution UV spectra of the source.
Goldstein et al. (2004) and Watanabe et al. (2006) used high-resolution Chandra X-ray spectral data to constrain the ionization structure and the geometrical distribution of material in the system. Intensities of the X-ray emission lines of highly ionized H- and He-like ions were found to be compatible with the smooth wind model (Castor et al. 1975). However, most of the X-ray recombination lines were found to come from between the neutron star and the primary, suggesting an enhanced density in this region, most likely due to photoionization-driven reduction in radiative force. In fact, the velocity shifts of the highly ionized recombination emission lines were found to be smaller in magnitude by several hundred kilometers per second than the predictions for the smooth wind, which directly supports the presence of the photoionization wake.
Performing a detailed study of the global wind structure is complicated, however, by the dramatic variability of both the wind, and the X-ray feedback from the pulsar. Studying this variability provides insight on details of wind acceleration and interaction with the neutron star and is best addressed with high-quality dedicated observations such as those presented for Vela X−1 by Watanabe et al. (2006) or Nagase et al. (1986), who performed detailed time-resolved spectral analysis. On the other hand, to to trace the persistent wind structure, not only long observations at different orbital phases, but also observations at multiple orbital cycles are important, which might not be feasible for dedicated observations. On the other hand, because it is one of the brightest persistent X-ray sources in the sky, Vela X−1 is an ideal target for monitor-type X-ray instruments such as Monitor of All-sky X-ray Image (MAXI), which can complement existing high-quality dedicated observations. In this work we used MAXI data to study the average orbital phase dependence of the X-ray spectrum in 2−30 keV in Vela X−1 with the aim of constraining the changes in photoelectric absorption induced by the photo-ionization-driven inhomogeneties in wind structure. We found that the observed changes in the absorption column are incompatible with the spherically symmetric smooth wind, and argue that the photoionization wake trailing the neutron star may indeed be responsible for the enhanced absorption.
2. Observations and data analysis
MAXI is the first astronomical mission operated on the International Space Station (ISS; Matsuoka et al. 2009). It was installed on the Japanese Experiment Module Exposed Facility on July 16, 2009, and has been designed to surpass all operating X-ray monitors both in sensitivity and energy resolution. Two slit-slat X-ray cameras scan the entire sky every 92 min as the ISS follows its orbit. They operate in 0.5−12 keV (the Solid-state Slit Camera (SSC), Tomida et al. 2011), and 2−30 keV (the Gas Slit Camera (GSC), Mihara et al. 2011), which we used here. The camera consists of twelve Xe-gas proportional counters with slit-and-slat collimators limiting the field of view (FOV) to 1.5° × 160°, which scans the sky as the ISS orbits. The counters employ resistive carbon-wire anodes to acquire one-dimensional position sensitivity, and enable position reconstruction for every source in the FOV to about 30′. The large detector area of 5350 cm2 allows many brighter sources to be detected within one ~ 1 m scan. Typical daily exposures reach 3000 cm2 s, which enables spectral studies when multiple scans are combined. The relatively low uncertainty in the energy calibration of about 3%, the fair energy resolution ~18% (at 5.9 keV), and the robust background rejection via anti-coincidence with outer veto cells additionally aid spectral capabilities. The camera performance is summarized in Sugizaki et al. (2011).
The inspection of public Vela X−1 light curves provided by the MAXI team1 for every source detected by the GSC in several energy ranges suggests a significant dependence of the source spectrum on orbital phase. The comparison of the mission-long soft and hard light-curves folded with orbital period presented in Fig. 1 reveals that most changes occur in the soft 2−4 keV band, while other bands are less affected, which could be naturally explained with the strong changes in absorption column along the orbit. It is interesting also to note the spike in hard X-ray flux at phase ~0.4, which could potentialy provide additional constrains on the wind structure.
To go beyond studying the hardness ratios and to verify if their change is related to the photoelectric absorption, we performed an orbital-phase-resolved spectral analysis of MAXI GSC data obtained during period MJD 55141-56200 using the standard MAXI pipeline (Sugizaki et al. 2011; Nakahira et al. 2012) modified to allow arbitrary grouping of the individual scans. The individual scan duration is just about one minute, i.e., much shorter than the phase bin of ~1 day we are interested in, so grouping of the scans is a robust way to obtain the orbital-phase-resolved spectra. Using the ephemeris provided by Kreykenbohm et al. (2008), we calculated a list of start and end times for each phase bin, and extracted the spectra by grouping the individual scans accordingly. The effective exposure is uniformly distributed along the orbit and varies between 15−20 ks per phase bin. We rebined all extracted spectra to contain at least 200 photons per energy bin, and fit them in the 2−20 keV energy range using the comptonization model by Sunyaev & Titarchuk (1980) (CompST in XSPEC). We kept the temperature and optical depth the same for all spectra, and only allowed the flux and the absorption column to vary independently. This resulted in a statistically acceptable combined fit with  (χ = 941.2 for 831 degrees of freedom) with the best-fit values for temperature and optical depth kT = 6.4(5) keV, τ = 13.3(7), and the absorbtion column in 3.3(5) − 25(4) × 1022 atoms cm2 range. Estimating the continuum parameters independently does not improve the fit significantly.
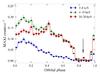 |
Fig. 1 Vela X−1 orbital light curves in 2−4 (blue circles), 4−10 (green triangles), and 10−20 keV (red squares) energy ranges assuming orbital parameters reported by Kreykenbohm et al. (2008), and folded from public MAXI light curves relative to the periastron. The arrow indicates the mid-eclipse phase. |
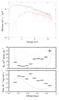 |
Fig. 2 Representative unfolded spectra for the most (red) and least (black) absorbed phase bins (top panel), and best-fit results for the absorption column and flux for all spectra (bottom panel). Absorption column and flux estimates for the smooth wind (black) and the orbital light curve (gray) are plotted in the bottom panel. Model flux mostly changes because of change in the relative velocity of the wind and the neutron star. |
Keeping the continuum parameters common for all phase bins is also justified because the observed shape of the spectrum does not change above 10 keV (within available statistics). We also confirmed that the data point distribution on a color–color plot is consistent with them being one-dimensional, controlled only by the absorption. The representative spectra and the orbital dependence of free parameters are presented in Fig. 2. The flux plotted in the figure is unabsorbed source flux in the 2−20 keV range derived from the spectral fit, and uncertainties are given at 1σ confidence level.
3. Discussion
First of all we would like to emphasize that the observed orbital dependence of the absorption column is asymmetric with respect to the conjunction, and thus cannot originate in a spherically symmetric wind of the primary. The asymmetry can only be caused by interaction of wind with the neutron star. The observed dependence closely resembles the results of hydrodynamical simulations carried out by Blondin et al. (1990) that account for a photo-ionization wake (see for instance Figs. 8 and 11 in their work), although the observed asymmetry is somewhat stronger in Vela X−1. A similar orbital dependence of the absorption column was observed in IGR J17252−3616 with XMM-Newton (Manousakis & Walter 2011), where the authors also attributed the enhanced absorption at later orbital phases to a photo-ionization wake. For the same source, Manousakis et al. (2012) performed detailed hydrodynamical simulations that confirmed their initial assumption that the peculiarly slow wind and the photo-ionization wake trailing the neutron star are responsible for the observed orbital dependence of the absorption column.
Indeed, comparing the observations with the results of detailed hydrodynamical simulations is essential for understanding the effects the accreting neutron star imposes on the wind structure. However, one needs to bear in mind the extreme complexity of these simulations and associated limitations. For instance, Manousakis et al. (2012) estimated the mass of the neutron star based on its impact on the simulated wind structure, which may be affected by the assumed simplified prescription for the radiative force that drives the wind (which is assumed to switch off within the Strömgren sphere). On the other hand, Krtička et al. (2012) showed that the radiative force field is much more complicated than that and has to be calculated self-consistently with the wind structure. Performing such calculations is beyond the scope of the present work, and taking into account that the results of a simplified approach presented in Manousakis & Walter (2011) and the more detailed simulations presented in Manousakis et al. (2012) agree reasonably well, we stick to the simpler prescription just to illustrate some important points suggested directly by the observations.
As a first step, it is interesting to compare the observed absorption column and flux with estimates from a standard smooth radiatively driven wind model (Castor et al. 1975) with the radial wind velocity profile,
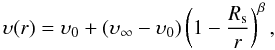 where υ0 ~ 10 km s-1 is the sound velocity at the surface of the optical star with radius Rs = 30 R⊙, υ∞ = 1100 km s-1 and β ~ 1 (Watanabe et al. 2006 and references therein). For the geometry of the system we assumed the orbital parameters reported by Kreykenbohm et al. (2008), that the system is observed edge on (van Kerkwijk et al. 1995 estimate i ≥ 75°), and adopted a mass-loss rate of 2 × 10⁻⁶ M⊙ yr-1 (Watanabe et al. 2006). The density at any distance may then be calculated from the continuity equation. This allows one also to calculate the X-ray flux assuming the Bondi-Hoyle spherical accretion and the distance to the source of 2 kpc (Nagase et al. 1986). The equivalent absorption column was calculated by integrating the density along the line of sight and assuming neutral absorber cross-sections (Morrison & McCammon 1983) with solar abudances. We neglected interstellar absorption in the direction of the source, which is estimated to be ≤5 × 10²¹ atoms cm-2 (Dickey & Lockman 1990), i.e., about an order of magnitude lower than the lowest observed value. The results are presented in Fig. 2.
As previously mentioned, this simple model cannot reproduce the observed asymmetric shape of the absorption curve along the entire orbit. On the other hand, if the observed asymmetry is caused by some structure trailing the neutron star, the agreement between the observed absorption column and the model for the first three points after the eclipse when this structure is behind the neutron star is remarkable. The observed average flux agrees well with our simple estimate, although its orbital dependence is not reproduced as well. It is important to emphasize that no parameters were adjusted to obtain the curves in Fig. 2, which were instead calculated using existing independent estimates for the parameters of the wind and the binary system.
Another important point is that both the absorption column and the flux depart from the model predictions, and that the observations start to depart from the model before the conjunction (phase 0.5). This means that the neutron star is not simply trailed by the region of slower, denser wind, but is submerged within it or at least resides at its boundary. This suggests a possible additional gradient in wind velocity in the vicinity of the neutron star, which might have profound effects on the amount of angular momentum captured by the neutron star, and therefore on its spin evolution. Detailed simulations with proper treatment of the radiative force and accurate wind velocity calculations are required to estimate their magnitude, however.
To better illustrate these points, and to qualitatively explain the observed changes in the absorption column along the orbit, we extended a simple smooth-wind model by adding a bent stream of slower, denser wind trailing the neutron star similar to the one emerging from simulations by Blondin et al. (1990), Feldmeier et al. (1996), and Manousakis et al. (2012). Even these quite detailed simulations probably do not provide a realistic picture, since the accelerating radiative force is treated very crudely. For our “toy” model we just assumed that the expected stream-like structure is described as a wind sector with a certain opening angle (~40°), the same mass-loss rate and velocity profile as the ambient wind. The wind velocity within the stream was, however, scaled down by a constant factor, thus increasing the density in the stream with respect to the ambient wind by about a factor of ten, which is calculated from the continuity equation. The stream then bends away from the neutron star and phase lag linearly increases with radius (∝0.1r), which corresponds to rigid rotation (Feldmeier et al. 1996). In reality, the wind velocity is certainly more complex, particularly between the companions (which implies, for instance, that the density wake will be offset from the primary). However, the line of sight does not cross this region, and most of the absorbing material resides in the outer wind, which has a simpler structure. The absorption curve calculated using our “toy” model is qualitatively consistent with observations as presented in Fig. 3, and the corresponding animation. The result is also quite similar to the one reported by Manousakis & Walter (2011) for IGR J17252−3616, which is not surprising because they used similar assumptions. We emphasize that in our case the model has mostly illustrative purpose, and only in conjunction with more detailed simulations (i.e., Manousakis et al. 2012) it is possible to conclude that the absrobtion in the dense stagnated wind region in the photoionization wake is most likely responsible for the observed absorption orbital profile in Vela X−1 as well. We did not attempt to model the orbital flux profile here, since the accretion rate mostly depends on the relative velocity of the wind and the neutron star, which cannot be estimated without detailed calculations of the wind-driving force. Taking into account the reasonable agreement of the observed flux and estimated luminosity for unperturbed wind (Fig. 2), it is clear, however, that the wind velocity in the vicinity of the neutron star must not drascically decrease, i.e., it most likely resides at the edge of the photoionization wake.
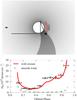 |
Fig. 3 Top panel: sketch of the system with the stream trailing the neutron star as it orbits HD 77581; the solid line indicates the wind density distribution along the line of sight (indicated with an arrow). Bottom panel: orbital absorption curve as observed with MAXI (crosses, uncertainties at 1σ confidence level), and model curves calculated for the smooth-wind model (dashed line, see also Fig. 2), and for a model with stream trailing the neutron star (solid line). We arbitrary shifted the curve for the smooth model to enhance the plot clarity. |
4. Conclusions
We have investigated the global stellar wind structure in Vela X−1 exploiting the continuous monitoring of the source with MAXI and its admirable spectral capabilities. We measured the average orbital dependence of the absorption column in the system and of the intrinsic source X-ray flux in Vela X−1, and found that both depart significantly from the expectations for a smooth-wind model. We attributed these discrepancies to a photo-ionization wake, which is expected to manifest as a denser stream-like region trailing the neutron star. We constructed a simple model to qualitatively describe the impact of this stream on the orbital dependence of the absorption column, and found that the neutron star must reside either within it or at the leading edge. We found that this simple mode agrees quite well with observations, which provide important constraints for future more detailed wind simulations. From an observational point of view, our result also poses a direct science case for and highlights the importance of the modern X-ray monitoring missions like MAXI and the upcoming WFM onboard LOFT.
Online material
Movie of Fig. 3 Access Supplementary Material
Acknowledgments
V.D. and A.S. thank the Deutsches Zentrums fr Luft- und Raumfahrt (DLR) and Deutsche Forschungsgemeinschaft (DFG) for financial support (grant DLR 50 OR 0702). V.D. also thanks the entire MAXI team for the collaboration and hospitality in RIKEN.
References
- Blondin, J. M., Kallman, T. R., Fryxell, B. A., & Taam, R. E. 1990, ApJ, 356, 591 [NASA ADS] [CrossRef] [Google Scholar]
- Castor, J. I., Abbott, D. C., & Klein, R. I. 1975, ApJ, 195, 157 [NASA ADS] [CrossRef] [Google Scholar]
- Dickey, J. M., & Lockman, F. J. 1990, ARA&A, 28, 215 [NASA ADS] [CrossRef] [MathSciNet] [Google Scholar]
- Doroshenko, V., Santangelo, A., & Suleimanov, V. 2011, A&A, 529, A52 [NASA ADS] [CrossRef] [EDP Sciences] [Google Scholar]
- Feldmeier, A., Anzer, U., Boerner, G., & Nagase, F. 1996, A&A, 311, 793 [NASA ADS] [Google Scholar]
- Fürst, F., Kreykenbohm, I., Pottschmidt, K., et al. 2010, A&A, 519, A37 [NASA ADS] [CrossRef] [EDP Sciences] [Google Scholar]
- Goldstein, G., Huenemoerder, D. P., & Blank, D. 2004, AJ, 127, 2310 [NASA ADS] [CrossRef] [Google Scholar]
- Kendziorra, E., Mony, B., Kretschmar, P., et al. 1992, in NASA, The Compton Observatory Science Workshop, 217 [Google Scholar]
- Kreykenbohm, I., Wilms, J., Kretschmar, P., et al. 2008, A&A, 492, 511 [NASA ADS] [CrossRef] [EDP Sciences] [Google Scholar]
- Krtička, J., Kubát, J., & Skalický, J. 2012, ApJ, 757, 162 [NASA ADS] [CrossRef] [Google Scholar]
- Makishima, K., & Mihara, T. 1992, in Frontiers Science Series, Proc. 28th Yamada Conf. (Japan: Universal Academy Press), 23 [Google Scholar]
- Makishima, K., Mihara, T., Nagase, F., & Tanaka, Y. 1999, ApJ, 525, 978 [NASA ADS] [CrossRef] [Google Scholar]
- Manousakis, A., & Walter, R. 2011, A&A, 526, A62 [NASA ADS] [CrossRef] [EDP Sciences] [Google Scholar]
- Manousakis, A., Walter, R., & Blondin, J. M. 2012, A&A, 547, A20 [NASA ADS] [CrossRef] [EDP Sciences] [Google Scholar]
- Matsuoka, M., Kawasaki, K., Ueno, S., et al. 2009, PASJ, 61, 999 [NASA ADS] [CrossRef] [Google Scholar]
- Mihara, T., Nakajima, M., Sugizaki, M., et al. 2011, PASJ, 63, 623 [NASA ADS] [Google Scholar]
- Morrison, R., & McCammon, D. 1983, ApJ, 270, 119 [NASA ADS] [CrossRef] [Google Scholar]
- Nagase, F. 1989, PASJ, 41, 1 [NASA ADS] [Google Scholar]
- Nagase, F., Hayakawa, S., Sato, N., Masai, K., & Inoue, H. 1986, PASJ, 38, 547 [NASA ADS] [Google Scholar]
- Nakahira, S., Koyama, S., Ueda, Y., et al. 2012, PASJ, 64, 13 [NASA ADS] [Google Scholar]
- Oskinova, L. M., Hamann, W.-R., & Feldmeier, A. 2007, A&A, 476, 1331 [NASA ADS] [CrossRef] [EDP Sciences] [Google Scholar]
- Quaintrell, H., Norton, A. J., Ash, T. D. C., et al. 2003, A&A, 401, 313 [NASA ADS] [CrossRef] [EDP Sciences] [Google Scholar]
- Rappaport, S. 1975, IAU Circ., 2869, 2 [NASA ADS] [Google Scholar]
- Sugizaki, M., Mihara, T., Serino, M., et al. 2011, PASJ, 63, 635 [NASA ADS] [Google Scholar]
- Sunyaev, R. A., & Titarchuk, L. G. 1980, A&A, 86, 121 [NASA ADS] [Google Scholar]
- Tomida, H., Tsunemi, H., Kimura, M., et al. 2011, PASJ, 63, 397 [NASA ADS] [Google Scholar]
- van Kerkwijk, M. H., van Paradijs, J., Zuiderwijk, E. J., et al. 1995, A&A, 303 [Google Scholar]
- van Loon, J. T., Kaper, L., & Hammerschlag-Hensberge, G. 2001, A&A, 375 [Google Scholar]
- Watanabe, S., Sako, M., Ishida, M., et al. 2006, ApJ, 651, 421 [NASA ADS] [CrossRef] [Google Scholar]
All Figures
|
Fig. 1 Vela X−1 orbital light curves in 2−4 (blue circles), 4−10 (green triangles), and 10−20 keV (red squares) energy ranges assuming orbital parameters reported by Kreykenbohm et al. (2008), and folded from public MAXI light curves relative to the periastron. The arrow indicates the mid-eclipse phase. |
| In the text | |
|
Fig. 2 Representative unfolded spectra for the most (red) and least (black) absorbed phase bins (top panel), and best-fit results for the absorption column and flux for all spectra (bottom panel). Absorption column and flux estimates for the smooth wind (black) and the orbital light curve (gray) are plotted in the bottom panel. Model flux mostly changes because of change in the relative velocity of the wind and the neutron star. |
| In the text | |
|
Fig. 3 Top panel: sketch of the system with the stream trailing the neutron star as it orbits HD 77581; the solid line indicates the wind density distribution along the line of sight (indicated with an arrow). Bottom panel: orbital absorption curve as observed with MAXI (crosses, uncertainties at 1σ confidence level), and model curves calculated for the smooth-wind model (dashed line, see also Fig. 2), and for a model with stream trailing the neutron star (solid line). We arbitrary shifted the curve for the smooth model to enhance the plot clarity. |
| In the text | |
Current usage metrics show cumulative count of Article Views (full-text article views including HTML views, PDF and ePub downloads, according to the available data) and Abstracts Views on Vision4Press platform.
Data correspond to usage on the plateform after 2015. The current usage metrics is available 48-96 hours after online publication and is updated daily on week days.
Initial download of the metrics may take a while.