Fig. 3
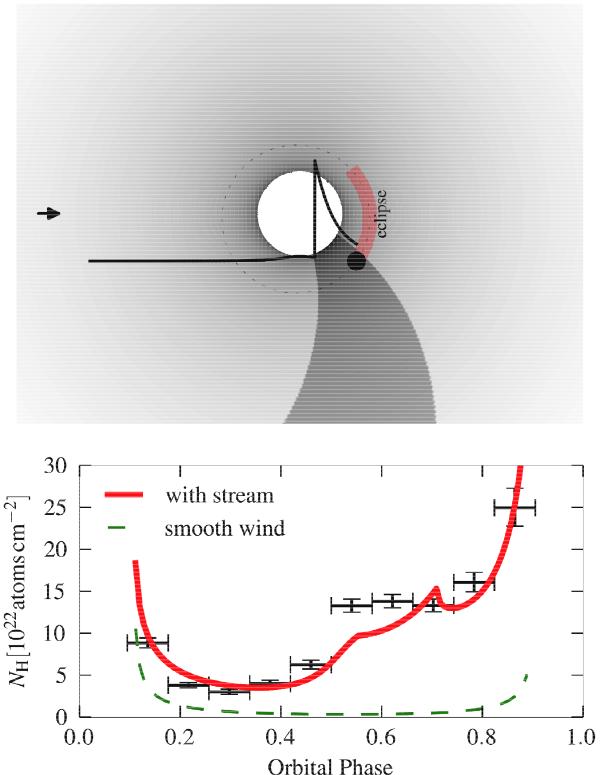
Top panel: sketch of the system with the stream trailing the neutron star as it orbits HD 77581; the solid line indicates the wind density distribution along the line of sight (indicated with an arrow). Bottom panel: orbital absorption curve as observed with MAXI (crosses, uncertainties at 1σ confidence level), and model curves calculated for the smooth-wind model (dashed line, see also Fig. 2), and for a model with stream trailing the neutron star (solid line). We arbitrary shifted the curve for the smooth model to enhance the plot clarity.
Current usage metrics show cumulative count of Article Views (full-text article views including HTML views, PDF and ePub downloads, according to the available data) and Abstracts Views on Vision4Press platform.
Data correspond to usage on the plateform after 2015. The current usage metrics is available 48-96 hours after online publication and is updated daily on week days.
Initial download of the metrics may take a while.