Fig. 2
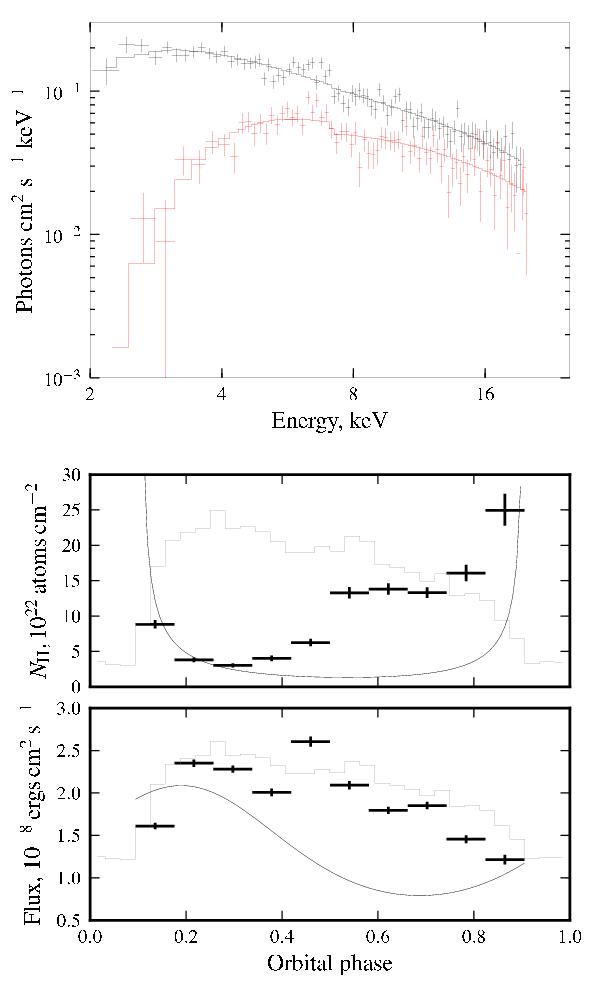
Representative unfolded spectra for the most (red) and least (black) absorbed phase bins (top panel), and best-fit results for the absorption column and flux for all spectra (bottom panel). Absorption column and flux estimates for the smooth wind (black) and the orbital light curve (gray) are plotted in the bottom panel. Model flux mostly changes because of change in the relative velocity of the wind and the neutron star.
Current usage metrics show cumulative count of Article Views (full-text article views including HTML views, PDF and ePub downloads, according to the available data) and Abstracts Views on Vision4Press platform.
Data correspond to usage on the plateform after 2015. The current usage metrics is available 48-96 hours after online publication and is updated daily on week days.
Initial download of the metrics may take a while.