Fig. 7
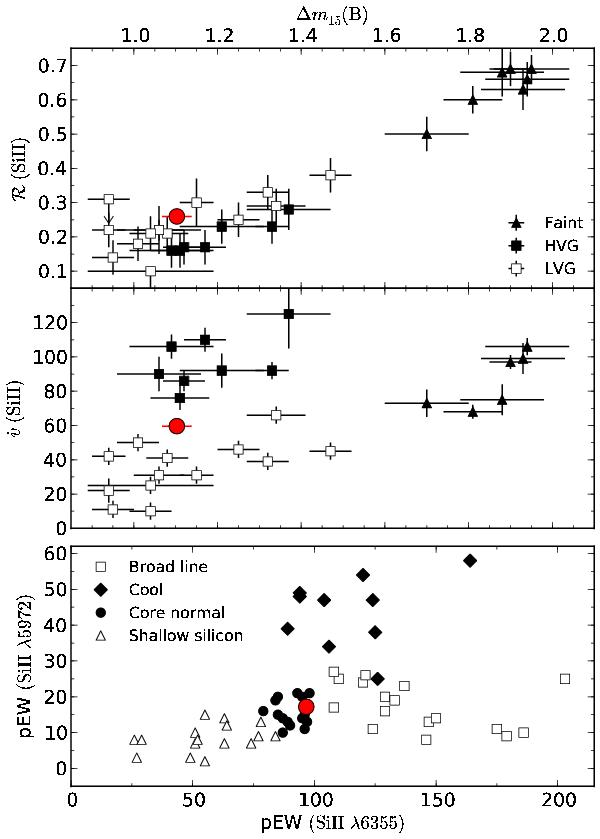
Top: ℛ(Si ii) and  (Si ii) versus SN decline rate Δm15. Comparison data and sub-classes from Benetti et al. (2005), updated with measurements by Hachinger et al. (2006) and Taubenberger et al. (2008). Bottom: pEW (Si iiλ5972) versus pEW (Si iiλ6355). Comparison data and sub-classes from Branch et al. (2009). SN 2011fe is represented by a filled red circle on all panels.
Current usage metrics show cumulative count of Article Views (full-text article views including HTML views, PDF and ePub downloads, according to the available data) and Abstracts Views on Vision4Press platform.
Data correspond to usage on the plateform after 2015. The current usage metrics is available 48-96 hours after online publication and is updated daily on week days.
Initial download of the metrics may take a while.