Fig. 5
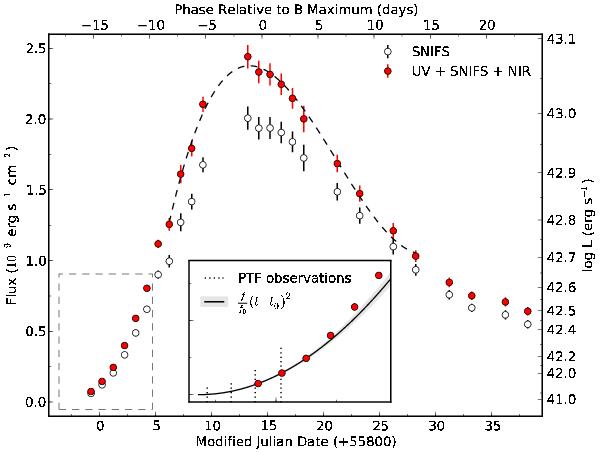
Bolometric light curve for SN 2011fe (filled red circles). The open circles represent the integrated flux over the full SNIFS wavelength range and the dashed line is a cubic spline fit for determination of the date of maximum. The inset is a zoom of the area marked by a dashed box, where a quadratic rise is fit to the first 3 nights of SNIFS observations. The vertical dotted lines mark the time of observations presented by Nugent et al. (2011b).
Current usage metrics show cumulative count of Article Views (full-text article views including HTML views, PDF and ePub downloads, according to the available data) and Abstracts Views on Vision4Press platform.
Data correspond to usage on the plateform after 2015. The current usage metrics is available 48-96 hours after online publication and is updated daily on week days.
Initial download of the metrics may take a while.