Fig. 2
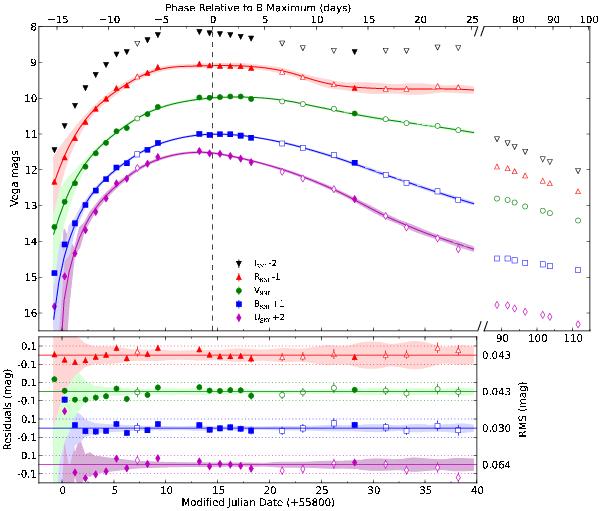
SN 2011fe synthesized light curves using the UBVRISNf filter set. Filled and open symbols stand for photometric and non-photometric nights respectively. The results of a SALT2 simultaneous fit of UBVRSNf in the phase range −16 < t < +25 d are shown as solid lines, along with the corresponding residuals (SALT2 – SNIFS) on the lower panel. The shaded areas represent the SALT2 model error. The residuals for the first points of USNf and BSNf fall outside the panel, and the rms on the residuals for each band ignores the first 2 points. The break in the time axis corresponds to the ~50 day gap in follow-up during which SN 2011fe was not visible during the night from Hawaii. Note the change of scale of the extended time axis covering the late observations.
Current usage metrics show cumulative count of Article Views (full-text article views including HTML views, PDF and ePub downloads, according to the available data) and Abstracts Views on Vision4Press platform.
Data correspond to usage on the plateform after 2015. The current usage metrics is available 48-96 hours after online publication and is updated daily on week days.
Initial download of the metrics may take a while.