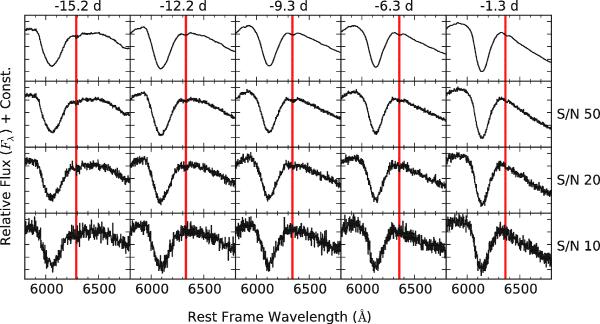
Fig. 13

Effect of noise at various phases on the C iiλ6580 absorption notch. The top row depicts the neighborhood of the feature as observed by SNIFS. Each successive row simulates progressively noisier observations, with the S/N per Å labeled at right. The red vertical line depicts the center of the C ii notch to guide the eye. Early observations are no guarantee of a C ii detection even if it is there at lower S/N but generally the feature becomes harder to discern with time as the notch amplitude decreases. Wavelength and flux scales depicted are the same in each panel.
Current usage metrics show cumulative count of Article Views (full-text article views including HTML views, PDF and ePub downloads, according to the available data) and Abstracts Views on Vision4Press platform.
Data correspond to usage on the plateform after 2015. The current usage metrics is available 48-96 hours after online publication and is updated daily on week days.
Initial download of the metrics may take a while.


