Fig. 12
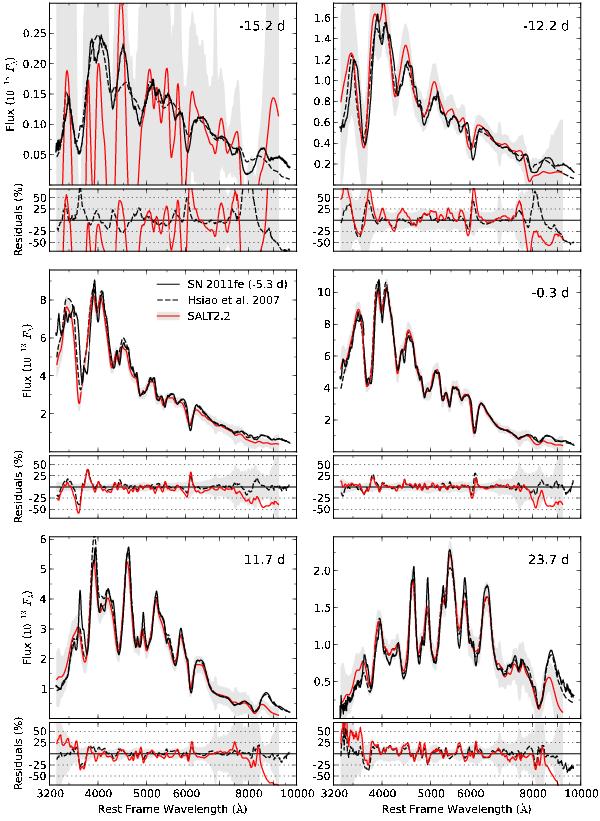
Comparison of six different phases of SN 2011fe (black line) with the Hsiao et al. (2007) (black dashed lines) and SALT2 (red line with grey error model) SNe Ia spectral surface templates. The Hsiao et al. (2007) spectra are warped to match the observed broad-band colors of SN 2011fe. SALT2 spectra are created directly from the template using the light curve fit parameters. The lower panels plot the percent residuals of each template with relation to the observed SN 2011fe spectra.
Current usage metrics show cumulative count of Article Views (full-text article views including HTML views, PDF and ePub downloads, according to the available data) and Abstracts Views on Vision4Press platform.
Data correspond to usage on the plateform after 2015. The current usage metrics is available 48-96 hours after online publication and is updated daily on week days.
Initial download of the metrics may take a while.