Fig. 11
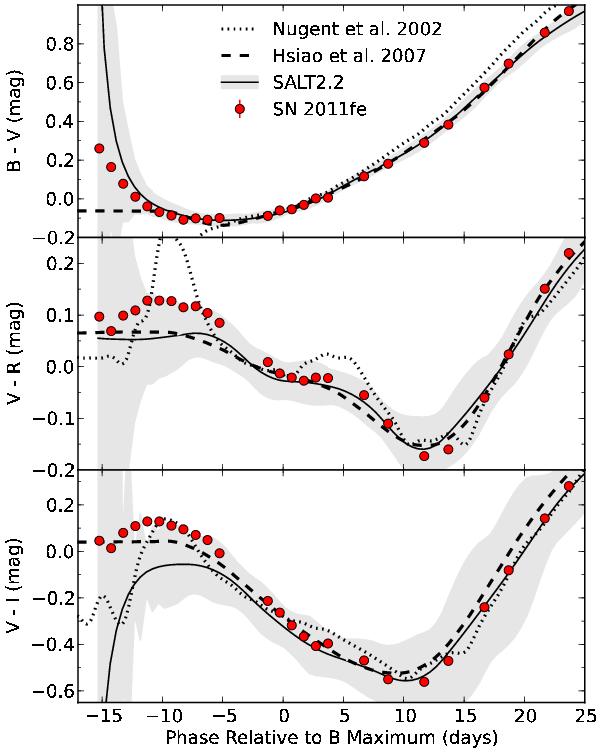
Synthetic color curves of SN 2011fe from SNIFS spectrophotometry. Both spectral templates from Nugent et al. (2002); Hsiao et al. (2007) are corrected to the observed stretch and peak colors. The SALT2 curves are derived from the fitted light curves on the different bands. The error bars on the SN 2011fe values are smaller than the plot symbols.
Current usage metrics show cumulative count of Article Views (full-text article views including HTML views, PDF and ePub downloads, according to the available data) and Abstracts Views on Vision4Press platform.
Data correspond to usage on the plateform after 2015. The current usage metrics is available 48-96 hours after online publication and is updated daily on week days.
Initial download of the metrics may take a while.