Fig. 1
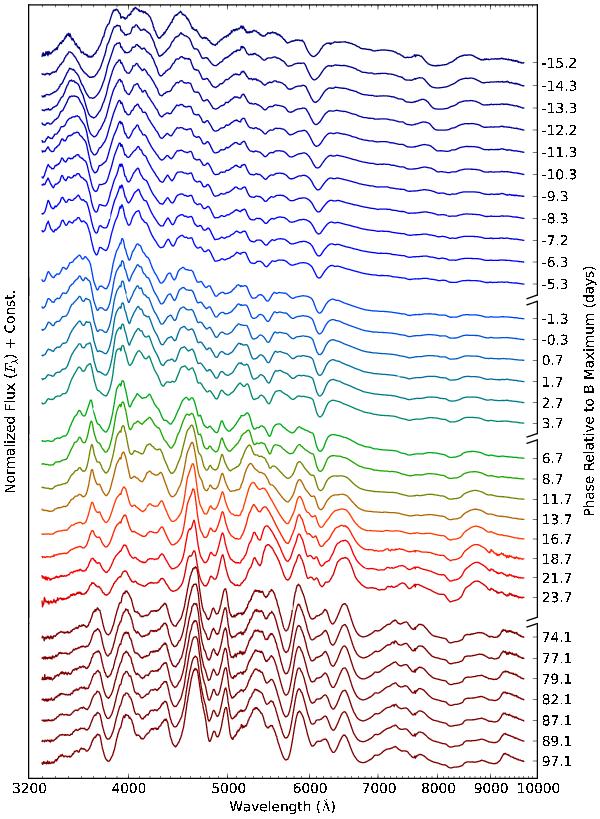
SNIFS spectrophotometric time series of SN 2011fe from −15 to 100 days relative to B-band maximum light. Breaks in the axis on the right indicate gaps and changes to the observing cadence. The first break corresponds to a four-day gap in daily cadence before maximum. The second marks the change from daily to alternating two/three day cadence. The final break is a 50 day hiatus imposed by lack of accessibility to the target from Mauna Kea.
Current usage metrics show cumulative count of Article Views (full-text article views including HTML views, PDF and ePub downloads, according to the available data) and Abstracts Views on Vision4Press platform.
Data correspond to usage on the plateform after 2015. The current usage metrics is available 48-96 hours after online publication and is updated daily on week days.
Initial download of the metrics may take a while.