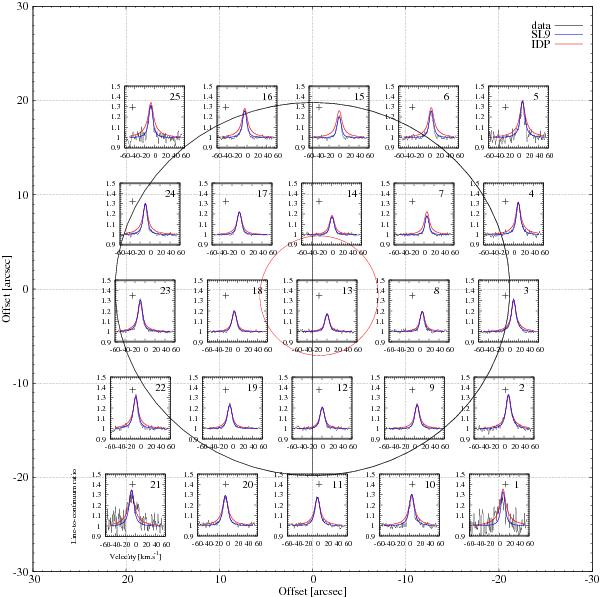
Fig. 11

Water 5 × 5 raster map at 1669.9 GHz obtained with Herschel/HIFI on July 7, 2010, expressed in terms of l/c and smoothed to a spectral resolution of 12 MHz (observation are plotted in black). Jupiter is represented with the red ellipse, and its rotation axis is also displayed. The black crosses indicate the center of the various pixels after averaging the H and V polarizations. The beam is represented for the central pixel by the red dotted circle.These high S/N observations rule out the IDP source model (red lines) because they result (i) in narrower lines than the ones produced by the IDP model; and (ii) in a non-uniform spatial distribution of water. Even if the flux in the northernmost pixels is adjusted to lower values to fit the l/c, the IDP model fails to reproduce the line wings (see Fig. 12). By adjusting the local water column density by rescaling the SL9 vertical profile, we find that an SL9 model (blue line), in which all water resides at pressures lower than 2 mbar, enables one to reproduce the observed map.
Current usage metrics show cumulative count of Article Views (full-text article views including HTML views, PDF and ePub downloads, according to the available data) and Abstracts Views on Vision4Press platform.
Data correspond to usage on the plateform after 2015. The current usage metrics is available 48-96 hours after online publication and is updated daily on week days.
Initial download of the metrics may take a while.


