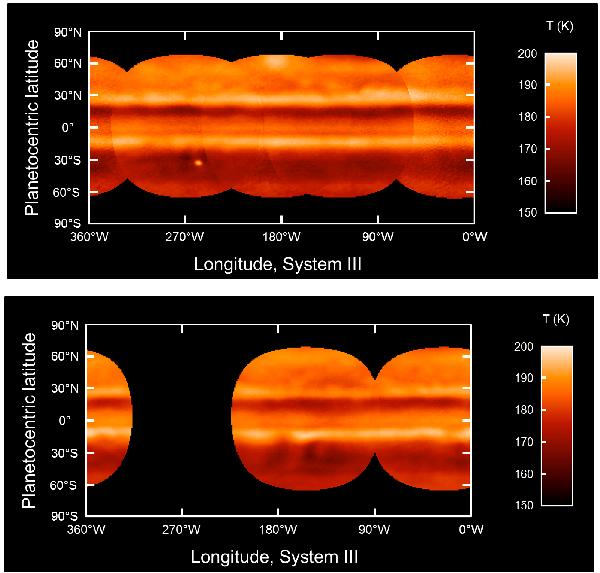
Fig. 10

IRTF/MIRSI radiance observations at 7.8 μm in the ν4 rotational-vibrational band of methane, carried out on 25 June−1 July 2010 (top) and 5−6 December 2010 (bottom). These observations are essentially sensitive to the stratospheric temperature between 1 and 40 mbar. The color scale gives the correspondence between radiances and stratospheric temperatures at 2 mbar, according to our derivation procedure (see text for limitations). These maps suggest that the northern hemisphere is generally warmer than the southern hemisphere. The bright belt seen around 15 °S in both maps (as well as in the TEXES data; see Fig. 9) is a possible explanation for the ~4 K increase seen in the PACS 66.4 μm map between the equator and 25 °S. The bright dot seen in the 25 June−1 July 2010 map is Io and had only marginal effects on the zonal mean results.
Current usage metrics show cumulative count of Article Views (full-text article views including HTML views, PDF and ePub downloads, according to the available data) and Abstracts Views on Vision4Press platform.
Data correspond to usage on the plateform after 2015. The current usage metrics is available 48-96 hours after online publication and is updated daily on week days.
Initial download of the metrics may take a while.


