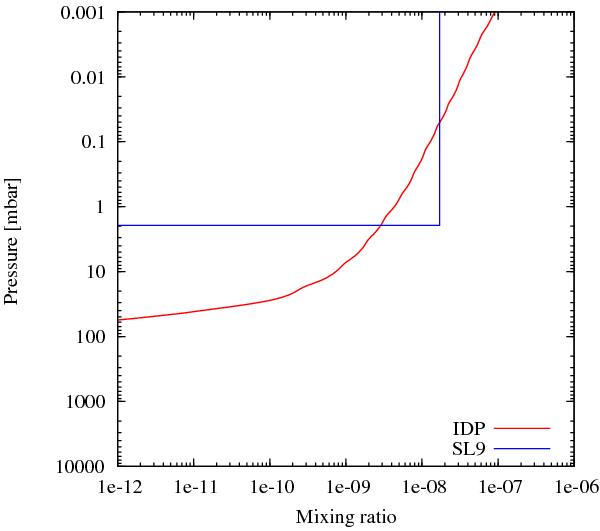
Fig. 8

Nominal water vertical profiles used in the analysis of the HIFI and PACS maps. The IDP profile (red solid line) was computed with the photochemical model of Cavalié et al. (2008b), using the nominal thermal profile of Fig. 6 and a standard K(z) profile from Moses et al. (2005). In the SL9 profile, a cut-off level was set to p0 = 2 mbar. This is the highest value of p0 that enables reproducing all the HIFI lines. In this profile, the water mixing ratio is 1.7 × 10⁻⁸ as in the central pixel (number 13) of the HIFI map.
Current usage metrics show cumulative count of Article Views (full-text article views including HTML views, PDF and ePub downloads, according to the available data) and Abstracts Views on Vision4Press platform.
Data correspond to usage on the plateform after 2015. The current usage metrics is available 48-96 hours after online publication and is updated daily on week days.
Initial download of the metrics may take a while.


