Fig. 4

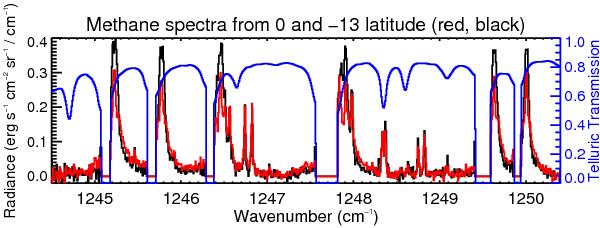
Methane emission spectra from 13 °S latitude (black) and from the equator (red) showing the different spectral shape and strength from the May 2009 observations with TEXES. The spectra are at an airmass between 1 and 1.2. The blue curve represents the telluric transmission. Owing to the high Jupiter/Earth velocity and the high spectral resolution achieved by TEXES, we were able to easily separate the Jovian methane emission from the telluric methane absorption. Gaps in the data are caused by telluric transmission regions that are too opaque to retrieve useful data. The red and black spectra have been flat-fielded by the black chopper wheel minus the sky emission, which performs a first-order division of the atmosphere.
Current usage metrics show cumulative count of Article Views (full-text article views including HTML views, PDF and ePub downloads, according to the available data) and Abstracts Views on Vision4Press platform.
Data correspond to usage on the plateform after 2015. The current usage metrics is available 48-96 hours after online publication and is updated daily on week days.
Initial download of the metrics may take a while.


