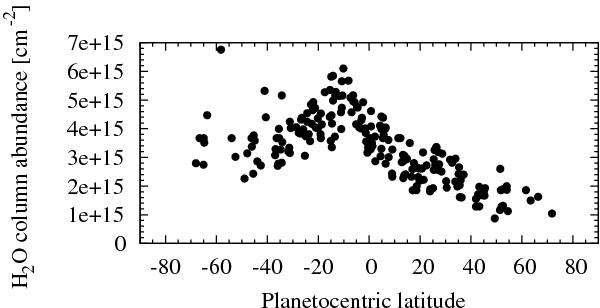
Fig. 16

Latitudinal section of the beam-convolved column density of water as derived from the 66.4 μm map. Only the pixels within the planetary disk are represented here. The peak values around 15 °S can most probably be attributed to the warmer temperatures observed around this latitude. The marginal increase seen around 30 °N could be due to the bright band detected at these latitudes in 2010 in the IRTF/MIRSI observations (see Fig. 14).
Current usage metrics show cumulative count of Article Views (full-text article views including HTML views, PDF and ePub downloads, according to the available data) and Abstracts Views on Vision4Press platform.
Data correspond to usage on the plateform after 2015. The current usage metrics is available 48-96 hours after online publication and is updated daily on week days.
Initial download of the metrics may take a while.


