Fig. 14

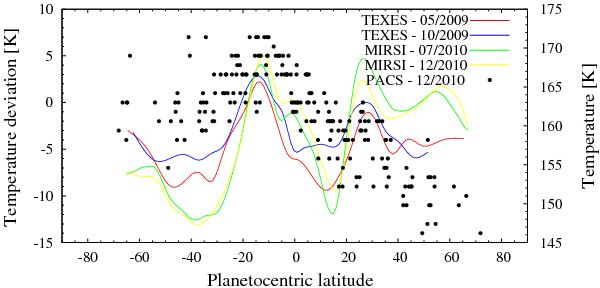
Latitudinal section of the temperature deviation from the nominal profile as derived from the 66.4 μm map (black points), assuming a spatially uniform distribution of water. Only the pixels within the planetary disk are represented here. The temperatures at a pressure of 2 mbar as retrieved from our IRTF/TEXES observations are also displayed (red line for the May 2009 data and blue line for the October 2009 data) as well as the temperatures derived from our IRTF/MIRSI data (green for July 2010 and yellow for December 2010). The temperatures derived from the MIRSI images are averages for the pressure range the observations are sensitive to (1−40 mbar). We applied to these values an offset of −20 K to bring them to the same scale as the TEXES values (see Sect. 3.2 for the reasons why we obtained these high values from the MIRSI data). The warm temperature belt seen around 15 °S is the most probable cause for the enhanced emission seen at these latitudes in our 66.4 μm map (see Fig. 13). There is only marginal evidence in the water emission observations for the warm belt seen in the IRTF/MIRSI data around 30 °N.
Current usage metrics show cumulative count of Article Views (full-text article views including HTML views, PDF and ePub downloads, according to the available data) and Abstracts Views on Vision4Press platform.
Data correspond to usage on the plateform after 2015. The current usage metrics is available 48-96 hours after online publication and is updated daily on week days.
Initial download of the metrics may take a while.


