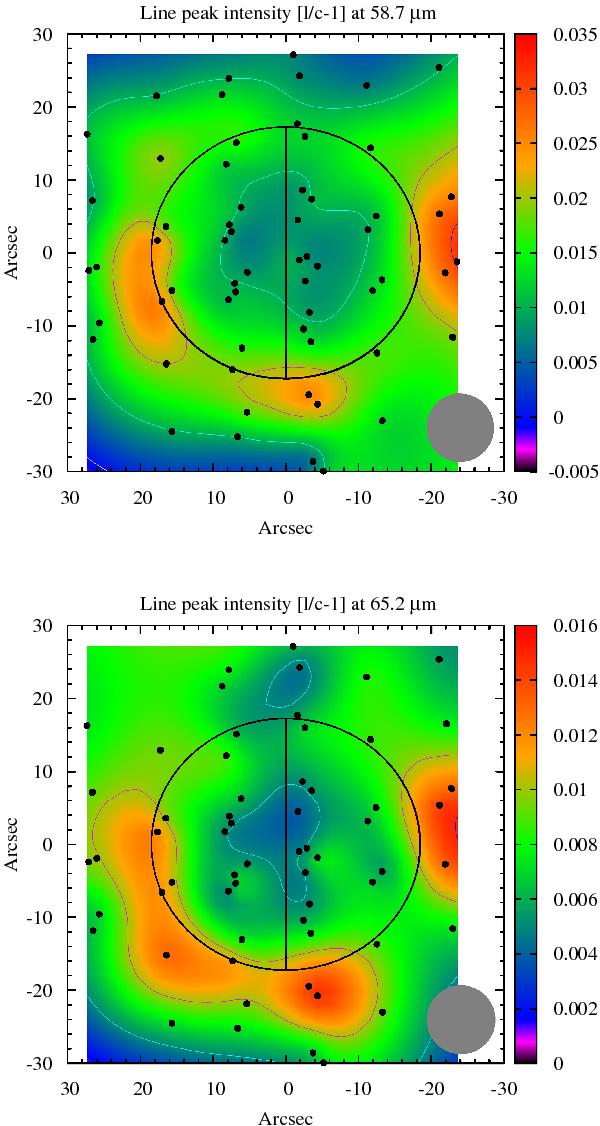
Fig. 2

Water maps of the line peak intensity (=l/c-1, thus in % of the continuum) at 58.7 and 65.2 μm observed by the PACS spectrometer on December 8, 2009. Jupiter is represented by the black ellipse, and its rotation axis is also displayed. The beam is represented by a gray filled circle. Both maps indicate that there is less emission in the northern hemisphere than in the southern (best seen in the limb emission).
Current usage metrics show cumulative count of Article Views (full-text article views including HTML views, PDF and ePub downloads, according to the available data) and Abstracts Views on Vision4Press platform.
Data correspond to usage on the plateform after 2015. The current usage metrics is available 48-96 hours after online publication and is updated daily on week days.
Initial download of the metrics may take a while.


