| Issue |
A&A
Volume 552, April 2013
|
|
|---|---|---|
| Article Number | A55 | |
| Number of page(s) | 7 | |
| Section | The Sun | |
| DOI | https://doi.org/10.1051/0004-6361/201220055 | |
| Published online | 22 March 2013 | |
Failed filament eruption inside a coronal mass ejection in active region 11121⋆
1
Astrophysics Research Centre, School of Mathematics and Physics, Queen’s
University,
Belfast, BT7 1NN,
Northern Ireland,
UK
e-mail:
This email address is being protected from spambots. You need JavaScript enabled to view it.
2
Department of Astronomy, University of Washington,
Box 351580, Seattle, WA
98195,
USA
3
Air Force Research Laboratory, Solar and Solar Disturbances, Sunspot, NM
88349,
USA
4
Abastumani Astrophysical Observatory, Ilia State
University, G. Tsereteli
3, 0612
Tbilisi,
Georgia
5
Centre for mathematical Plasma Astrophysics, Mathematics
Department, KU Leuven,
Celestijnenlaan 200B bus 2400, 3001
Heverlee,
Belgium
Received: 19 July 2012
Accepted: 22 February 2013
Abstract
Aims. We study the formation and evolution of a failed filament eruption observed in NOAA active region 11121 near the southeast limb on November 6, 2010.
Methods. We used a time series of SDO/AIA 304, 171, 131, 193, 335, and 94 Å images, SDO/HMI magnetograms, as well as ROSA and ISOON Hα images to study the erupting active region.
Results. We identify coronal loop arcades associated with a quadrupolar magnetic configuration, and show that the expansion and cancellation of the central loop arcade system over the filament is followed by the eruption of the filament. The erupting filament reveals a clear helical twist and develops the same sign of writhe in the form of inverse γ-shape.
Conclusions. The observations support the “magnetic breakout” process in which the eruption is triggered by quadrupolar reconnection in the corona. We propose that the formation mechanism of the inverse γ-shape flux rope is the magnetohydrodynamic helical kink instability. The eruption has failed because of the large-scale, closed, overlying magnetic loop arcade that encloses the active region.
Key words: Sun: corona / Sun: flares / Sun: magnetic topology / Sun: chromosphere / Sun: filaments, prominences / Sun: coronal mass ejections (CMEs)
Movies are available in electronic form at http://www.aanda.org
© ESO, 2013
1. Introduction
Solar eruptions are explosive ejections of large amounts of plasma from the lower to the upper layers of the solar atmosphere and are some of the most interesting events occurring in the active Sun. Eruptions associated with coronal mass ejections (CMEs) are known as full eruptions, while those that do not lead to a CME are termed failed eruptions. It is generally accepted that magnetic reconnection plays a crucial role in the process. However, the exact mechanism that drives solar eruptions remains to be identified. The classic tether-cutting eruption model is based on a single, highly sheared magnetic bipole. This model assumes that the reconnection, which occurs deep within the sheared core region below the filament, removes stabilising restraints (tethers), which in turn leads the flux rope to erupt (Moore & LaBonte 1980; Sturrock 1989; Moore & Roumeliotis 1992; Moore et al. 2001). Another eruption mechanism is that of the magnetic breakout model, which was first proposed by Antiochos (1998) and Antiochos et al. (1999). This requires a multipolar magnetic configuration with a central magnetic arcade that is the main restraining magnetic flux of the filament located underneath. The energy supply for the breakout eruption comes from the free magnetic energy of the filament, which can be efficiently stored in sheared and/or twisted non-potential magnetic configurations (Priest & Forbes 2002).When the central arcade expands upward and reconnects with the outer antiparallel field that overarches the whole region, it is removed and sidelobe loops of the quadrupole are created. This removal of the main constraint over the filament leads to the explosive eruption of the filament. The tether-cutting and breakout model both describe the disruption in the balance of the upward-directed force of magnetic pressure and the downward-directed force of magnetic tension.
The magnetohydrodynamic (MHD) helical kink instability of a magnetic flux rope anchored in the photosphere is considered as an alternative triggering mechanism for solar eruptive phenomena. This instability is the process that transforms twist (a measure of the windings of field lines about the axis of the flux rope) into writhe, a measure of the winding of the flux rope axis itself, (Rust & LaBonte 2005). It occurs when the twist exceeds a certain critical value. The conservation of helicity in ideal MHD requires that the resulting writhe, which can have the form of an inverse γ shape, should have the same sign as the transformed twist (Hood & Priest 1979; Baty 2001; Gerrard et al. 2001; Fan 2005; Török & Kliem 2005; Rust & LaBonte 2005; Srivastava et al. 2010).
Several observational studies of filament eruptions presented in recent years appear to agree with the breakout-initiation scenario (Aulanier et al. 2000; Sterling & Moore 2001; Manoharan & Kundu 2003; Ji et al. 2003; Gary & Moore 2004; Deng et al. 2005; Pohjolainen et al. 2005; Alexander et al. 2006; Joshi et al. 2007; Shen et al. 2012). The observations also show that reconnection, breakout, and tether-cutting can often all be present in the eruption (Sterling & Moore 2004). A combination of the magnetic breakout scenario and kink instability could be responsible for the eruption event presented by Williams et al. (2005).
In this paper, we observationally study a failed filament eruption associated with an M5.4-class flare (Schrijver 2011; Woods et al. 2011). We describe the morphology and dynamic of the loop arcades and filament before and after the eruption, and interpret our observations in terms of the magnetic breakout and kink instability models.
2. Instruments and data
The observations were obtained between 15:10−18:01 UT on November 6, 2010 with the Solar Dynamics Observatory (SDO; Lemen et al. 2010), the Rapid Oscillations in the Solar Atmosphere (ROSA; Jess et al. 2010) imaging system mounted on the Dunn Solar Telescope (DST), and the Improved Solar Observing Optical Network (ISOON) patrol telescope (Neidig et al. 1998; Balasubramaniam et al. 2010). The SDO Atmospheric Imaging Assembly (AIA) images were taken in the 304, 171, 131, and 91 Å bandpasses using a spatial sampling of 0.6′′/pixel and a 12 s cadence; the 1700 Å bandpass had a 24 s cadence. Owing to the SDO onboard exposure-time compensation during flare activity, the AIA image sequences consisted of frames captured with differing exposure times (0.1−2.9 s). To compensate for this, each AIA frame was normalised to its respective exposure time, resulting in a time series where true changes in intensity could clearly be observed. The magnetic topology of the observed active region was studied with SDO Helioseismic and Magnetic Imager (HMI; Schou et al. 2012) line-of-sight magnetograms.
ROSA carried out simultaneous Hα-line core imaging over a 48′′ × 52′′ field-of-view between 15:59−17:01 UT. A spatial sampling of 0.069′′/pixel was used to match the telescope diffraction limit in the blue part of the spectrum to that of the CCD. To keep the field-of-view the same, Hα was slightly oversampled, corresponding to a spatial resolution of 150 km (i.e. approximately three pixels). High-order adaptive optics were in operation throughout the observations and the imaging quality was further improved using the image-reconstruction algorithms of Wöger et al. (2008). The effective cadence after reconstruction was 5.28 s.
Full-disk Hα line centre images were also obtained using the ISOON patrol telescope with a cadence of 1 min and a sampling of 1.1′′/pixel. ISOON is operated by the USAF at the National Solar Observatory in Sunspot, NM and uses an effective 15-cm aperture telescope to image the Sun. The images are acquired in a narrow 80 mÅ bandpass in the Hα-line core, ±0.4 Å either side of the line core and in the continuum at 6300.3 Å. A 2048 × 2048 CCD camera (14-micron pixels; 1.1′′ sampling) obtains images with exposure times of around 10−12 ms. These are corrected for dark-current fluctuations and compensated for changes in light sensitivity using flat-fields acquired immediately after the data acquisition.
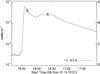 |
Fig. 1 GOES X-ray light curve (1.0−8.0 Å) of the M5.4 class flare of 6 November 2010 in NOAA 11121. The “x” symbols indicate the times of the filament eruptions. |
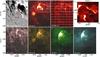 |
Fig. 2 Simultaneous SDO/AIA, ROSA, ISOON images and SDO/HMI magnetogram of the observed erupting region. Five pink, dotted boxes in the HMI line-of-sight (LOS) magnetogram denote basic patches of positive and negative magnetic flux concentrations. The erupting filament, which is assumed to be originally located along the magnetic neutral line somewhere between regions 3 and 5, is indicated by the dashed lines in panel a). The large white boxes in the AIA 304 Å and ISOON images indicate the ROSA Hα field-of-view. The AIA 1700 Å image shows the position of two flare ribbons (marked as R1 and R2). LA1, LA2, and LA3 are three different loop arcade systems. The temporal evolution of the AIA/ISOON/ROSA data depicted in panels b)−d) and f)−h) is shown in the movie provided with the online version. |
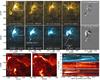 |
Fig. 3 Sequences of AIA 171 Å (panels a)−d)), 335 Å (panels f)−i) and running difference images (panels e) and j)) during the pre-eruption phase show the brightening on the top of the LA1 (referred to as the reconnection site), cancellation of LA1 and formation of the PRLA. Dotted white rectangles and arrows on panels e) and j) indicate the eruptive region and the direction of the eruption. Hα images (panels k) and l)) show filament threads (marked by white arrows) and their activation. Panels m)−o) are the time-distance diagrams of the eruptive filament as observed in the 335 Å, ROSA, and ISOON Hα lines plotted along cut 1, 2, and 3 in panels i) and k). The vertical dashed line (panels m)−o)) indicates the start time of the eruption (16:24 UT). White arrows (panels m)−o)) indicate the upward (eruptions) and downward (draining) plasma streams passing cuts 1, 2, and 3 in panels i) and k). |
3. Observations
The GOES light curve of the flaring active region NOAA 11121 shows that the main flare peak occurred at around 15:37 UT (Fig. 1). A slow CME from this active region was observed by the SOHO/LASCO coronagraph at around 15:40 UT. The AIA and ISOON instruments did not detect this CME. However, the first filament eruption observed in AIA 304 Å and ISOON Hα near the east ribbon (see panel e of Fig. 2) coincides with the CME (see online movie). An examination of this filament does not reveal clear rising motions or extensions in its morphology. This suggests that the filament eruption was either a very weak, failed/remnant part of the CME, or that it was directed in a vertical plane towards the observer, making a detailed study very difficult.
The second filament eruption became evident at around 16:24 UT during the secondary peak seen in the GOES light curve (Fig. 1) and is the main focus of this paper. In Fig. 2 we show the AIA, HMI, ROSA, and ISOON images of the observed active region at 15:59 UT (22 min after the peak of the M5.4 flare and 25 min before the second filament eruption). The HMI line-of-sight magnetograms infer a multipolar magnetic field distribution. In the AIA 304, 171, and 94 Å images we can identify a loop arcade, labelled LA1, connecting magnetic regions 2 and 3 (Fig. 2). The high spatial resolution ROSA Hα and AIA 304, 171 Å images reveal a second loop arcade (LA2) connecting magnetic regions 3 and 4 (see Fig. 2). Furthermore, the AIA 131 Å bandpasses show a third larger loop arcade (LA3) connecting magnetic regions 1 and 4 that overlie the whole system.
A comparison of the AIA 304 Å images with the GOES light curve shows that LA1 was formed shortly after the flare peak (at around 15:37 UT) near the main flare ribbon (R2 on the AIA 1700 Å panel of Fig. 2 and online movie). This suggests that they are classical post-flare loop arcades.
Just before the eruption, between 15:59 and 16:24 UT, the loop arcade configurations of the flare region change dramatically. Small-scale fast plasma concentrations are seen to move from the top of the LA1 downward in both directions along the loops (see online movie). Fast jets near the brightening on the top of LA1 are also seen to be moving in the horizontal direction (see online movie). A sequence of images taken at the AIA 171 Å and 335 Å wavelengths (panels a−d and f−i of Fig. 3) between 16:02 and 16:24 UT show the gradual removal of the south-eastern part of LA1 and the appearance of a new sidelobe arcade, labelled PRLA (post-reconnection loop arcade) in Figs. 3 and 6 (see also online movie). This can also be seen in the running difference images shown in panels e and j of Fig. 3, which were constructed by subtracting an image at around 16:02 UT (22 min before eruption) from the image at 16:24 UT (just prior to the eruption). The locations of dark loops inside the white dotted boxes on panels e and j of Fig. 3, and bright areas left of the boxes, show the removal of LA1 and appearance of PRLA, respectively.
We used a time-series of AIA 304, 171, 131, 193, 335, 94 Å, ROSA, and ISOON Hα images to construct space-time diagrams (Figs. 3, 4). These show that at approximately 16:24 UT, shortly after the removal of LA1, the lower-lying filament, located along the neutral line between the negative polarity 3 and positive polarity 5 (Fig. 2), begins to rise and erupts (panels m−o of Fig. 3 and online movie). We fitted trajectories of plasma streams on the time-distance diagrams with a parabolic function (see Fig. 4) and determined the average acceleration as 120 m s-2 (~0.4 g⊙) for the upward plasma stream. Its projected average speed along cut 1 is about 65 ± 15 km s-1.
The eruption is shown in a sequence of snapshots in Fig. 5, which also demonstrate the morphological changes of the erupted flux rope in the AIA 304 Å and 171 Å bandpasses (see also online movie). In the initial stages the erupted loop rose in one end while the other remained fixed (panels b and b1 of Fig. 5). Panels c, c1, e, and e1 of Fig. 5 show clear twisting motions, and a helical twist of the erupted material following the formation of an inverse γ structure (panels d and d1 of Fig. 5 and online movies).
Our multiwavelength observations do not show evidence that during the eruption event some of the filament material left the corona and developed into a CME. Instead, the erupted plasma drains back down towards the chromosphere. The AIA and ROSA Hα time-distance diagrams clearly show the downward plasma streams of the filament material (panels m and n of Figs. 3 and 4) along cut 1 with an average projected acceleration of ~78 m s-1 (~0.3 g⊙) and average downward speed of 60 ± 10 km s-1. The bottom panel of Fig. 4 is a time-distance diagram along the γ-shape filament apex (along cut 4) showing downward motions of the apex plasma. Analysis of the timeseries shows that the inverted γ-shape structure fades away and finally disappears at around 17:50 UT (see online movie). We note that a slow CME from this active region observed by the SOHO/LASCO coronagraph does not seem to be associated with the filament described in this paper and is most likely related to the first eruption that occurred during the main flare peak at around 15:37 UT.
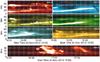 |
Fig. 4 Time-distance diagrams along cut 1 (see panel i of Fig. 3) show the simultaneous upward motions of the eruption and downward streams in different AIA bandpasses. The red dotted line in the top right panel is the parabolic fit to the moving features. The corresponding accelerations are also shown. The bottom panel is a time-distance diagram taken along cut 4 (see panel i) of Fig. 3), showing the downward motions of the apex plasma. |
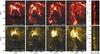 |
Fig. 5 Sequences of AIA 304 and 171 Å images showing the eruption and post-eruption evolution of the filament. The erupted material shows clear helical twist at around 16:39 UT, as seen in panels c) and c1). Time-distance plots along vertical cut 5 and 6 also illustrate twisting motions of the erupted flux ropes (panel e) and e1)). The “+” symbols in panels d) and d1) track the inverse γ-shape structure with apparent crossing of the two filament legs. |
4. Interpretation and discussion
Our observations suggest that magnetic breakout can explain the initiation of the observed filament eruption. The breakout model requires a multipolar magnetic configuration, which does exists in the investigated region (see Figs. 2). The high spatial resolution ROSA Hα data indicate that the filament threads located near the left part of the Hα bright ribbon (see panel k and l of Fig. 3 and online movie) may be sheared magnetic structures, which can store a lot of non-potential, free magnetic energy. The observed filament threads may therefore be considered as a non-potential core field with sufficient free energy for eruption. We suggest that the filament is restrained by the overarching central flux arcade, LA1, seen in the 304, 171, 94, and 335 Å AIA bandpasses (Figs. 2, 3 and online movie). LA2 (see the ROSA Hα and the AIA 304, and 171 Å images of Fig. 2) is a sidelobe loop arcade of the quadrupole with LA3 (AIA 131 Å image of Fig. 2) overlying the whole system. The expansion of LA1, seen in panels a−d of Fig. 3, can form the current sheet between the opposite-oriented polarities LA1 and LA3, and the breakout reconnection between the two arcades can result in the gradual removal of LA1. The downflow of plasma blobs along the AIA 304 Å loops could be explained as a condensation of the hot coronal plasma in the post-flare loops (LA1) due to a thermal instability, while the horizontal jets coming from the brightening on the top of LA1 could be the reconnection outflows. The PRLA in Figs. 3 and 5 begins to form. Removing of a sufficient portion of LA1 reduces the stabilising tension force and allows the eruption of the lower-lying filament material (Antiochos et al. 1999; Aulanier et al. 2000). If a part of the observed post-flare loops (LA1) were shrinking downwards, as expected from the standard flare model (Forbes & Acton 1996), they could reconnect with the opposite-oriented filament field lines located underneath (Figs. 2). This may facilitate the rise of the flux rope, together with breakout reconnection between the expanding parts of LA1 and LA3.
The post-eruption dynamics of the filament material show evidence of the helical kink instability, a process through which twist is transformed into writhe (Rust & LaBonte 2005). At approximately 16:39 UT, the erupted plasma developed a clear twisted flux rope structure, as seen in panels c and c1 of Fig. 5 (see also online movie). During the next 20 min an inverse γ-shape filament formed, and the apparent crossing of the two filament legs is observed (panels d and d1 in Fig. 5). The inverse γ-shape has been associated with the presence of a so-called helical writhe, which is a measure of the winding of the flux rope axis. The conservation of helicity in ideal MHD requires that the resulting writhe must have the same sign as the initial twist (Rust & LaBonte 2005; Green et al. 2007). To determine the sign of the twist and writhe, we need to define which leg of the flux rope is in foreground and which is in background relative to the observer. Figure 5 (panels d and d1) shows that the filament segment that is connected to the right footpoint is in the foreground because it obscures the filament segment that is connected to the second footpoint (see also online movie). This means that the writhe has a right-handed positive sign. The helical twist in panels c and c1 of Fig. 5 has the same configuration. Thus, we conclude that writhe and twist both have the same polarity, which suggests that the helical kink instability of a twisted magnetic flux rope is the formation mechanism of the inverse γ-shape flux rope.
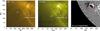 |
Fig. 6 AIA 171 and 193 Å images showing the large-scale, closed loops above the erupted flux rope at around 16:55 UT. The coresponding HMI LOS magnetogram indicates that these loops connect magnetic polarities 1 and 6 (circled). |
 |
Fig. 7 Simple schematic sketch of the breakout-initiation scenario for the observed eruption, showing that reconnection above the filament material between LA1 and LA3 removes the central flux system (LA1) and results in the final eruption (left and middle panels). The large-scale, asymmetric, closed, overlying magnetic loop arcade (LLA) could be the reason that the eruption is confined (right panel). |
The eruption did not lead to a CME and drained back onto the solar surface. There have been several observations of failed eruptions (Ji et al. 2003; Alexander et al. 2006; Liu et al. 2009), but it is still not clear exactly what defines the precise conditions that lead to a failed as opposed to a full eruption. According to statistics, about 44% of the eruptions associated with M-class flares do not lead to CMEs (Chen 2011). Gilbert et al. (2007) suggested that the position of the reconnection site in the inverse-polarity flux rope model can determine the outcome of an eruption, with reconnection below the filament most likely to produce a full eruption, and reconnection above the filament to produce a failed eruption (Gilbert et al. 2001, 2007; Alexander et al. 2006). Furthermore, previous observations suggest that in the magnetic breakout or kink instability scenario, the interaction between an eruptive filament and its magnetic environment can also play an important role in determining the nature of the eruption (Williams et al. 2005; Gibson & Fan 2006; Ji et al. 2003; Jiang et al. 2009). According to Ji et al. (2003), if the higher-lying magnetic field lines above the filament remain close, the eruption may not propagate into the corona although an overlying closed coronal magnetic field may not be a sufficient condition for a failed eruption to occur. The simulations of Török & Kliem (2005) showed that the kink instability could trigger a failed filament eruption if the overlying magnetic field decreases slowly with height. The degree of the helical twist in the filament may also determine the nature of the eruption (Rust & LaBonte 2005). Other factors may include the asymmetric confinement of the background field above the filament. This suggests that if the filament erupts asymmetrically with respect to the overlying loop arcade, it is more likely to become a failed eruption (Liu et al. 2009). In the observations presented here, the erupted filament and the whole active region is overlaid by a large-scale, closed coronal-loop arcade (LLA) seen in the AIA 171 and 193 Å data (Fig. 6). This coronal loop system connects magnetic polarities 1 and 6 and is not symmetric with respect to the filament (Fig. 6). The coronal loops in the LLA do not undergo any significant topological changes during the whole observing period. Apparently, the breakout reconnection has opened only the lower magnetic arcade (LA3) above the filament while higher field lines remained closed (Fig. 6). This suggests that the eruption may be confined by this large-scale loop arcade. Unfortunately, the analysis does not reveal the precise orientation of the erupted γ-shape flux-rope field with respect to the LLA. The field orientation does not seems to favour magnetic reconnection. A schematic diagram presented in Fig. 7 interprets the observed failed filament eruption.
5. Summary
We have presented multi-instrument/multi-wavelength observations of the solar eruption event in active region NOAA 11121 on 6 November 2010 using data obtained with the ROSA, SDO, and ISOON instruments. These show that the eruption process comprises the pre-eruption removal of the field lines above the filament, eruption of the filament, development of the strong helical twist into the erupted filament, formation of an inverse γ-shape structure, and the draining of filament material back to the solar surface. A morphological study of this event supports that the magnetic breakout scenario and helical kink instability are probably responsible for the observed evolution of the event. The large-scale, closed, overlying magnetic loop arcade may have confined the eruption. Future observations could focus on quantifying the amount of the helical twist, writhe, and magnetic field.
Online material
Movie of Fig. 2
Access Supplementary MaterialAcknowledgments
We thank an anonymous referee for many important comments and suggestions especially on the interpretation part of our manuscript. Observations were obtained at the National Solar Observatory, operated by the Association of Universities for Research in Astronomy, Inc (AURA) under agreement with the National Science Foundation. We thank the teams of SDO/AIA and SDO/HMI for providing valuable data. This work is supported by the Science and Technology Facilities Council (STFC). This work has been supported by the Leverhulme Trust grant F/00203/X. We thank the Air Force Office of Scientific Research, Air Force Material Command, USAF for sponsorship under grant number FA8655-09-13085. D.B.J. is grateful to the FWO for the award of a Marie Curie Pegasus Fellowship.
References
- Alexander, D., Liu, R., & Gilbert, H. R. 2006, ApJ, 653, 719 [NASA ADS] [CrossRef] [Google Scholar]
- Antiochos, S. K. 1998, ApJ, 502, L181 [NASA ADS] [CrossRef] [Google Scholar]
- Antiochos, S. K., DeVore, C. R., & Klimchuk, J. A. 1999, ApJ, 510, 485 [Google Scholar]
- Aulanier, G., DeLuca, E. E., Antiochos, S. K., McMullen, R. A., & Golub, L. 2000, ApJ, 540, 1126 [NASA ADS] [CrossRef] [Google Scholar]
- Balasubramaniam, K. S., Cliver, E. W., Pevtsov, A., et al. 2010, ApJ, 723, 587 [NASA ADS] [CrossRef] [Google Scholar]
- Baty, H. 2001, A&A, 367, 321 [NASA ADS] [CrossRef] [EDP Sciences] [Google Scholar]
- Chen, P. F. 2011, Liv. Rev. Sol. Phys., 8, 1 [Google Scholar]
- Deng, N., Liu, C., Yang, G., Wang, H., & Denker, C. 2005, ApJ, 623, 1195 [NASA ADS] [CrossRef] [Google Scholar]
- Fan, Y. 2005, ApJ, 630, 543 [NASA ADS] [CrossRef] [Google Scholar]
- Forbes, T. G., & Acton, L. W. 1996, ApJ, 459, 330 [NASA ADS] [CrossRef] [Google Scholar]
- Gary, G. A., & Moore, R. L. 2004, ApJ, 611, 545 [NASA ADS] [CrossRef] [Google Scholar]
- Gerrard, C. L., Arber, T. D., Hood, A. W., & Van der Linden, R. A. M. 2001, A&A, 373, 1089 [NASA ADS] [CrossRef] [EDP Sciences] [Google Scholar]
- Gibson, S. E., & Fan, Y. 2006, ApJ, 637, L65 [NASA ADS] [CrossRef] [Google Scholar]
- Gilbert, H. R., Holzer, T. E., Low, B. C., & Burkepile, J. T. 2001, ApJ, 549, 1221 [NASA ADS] [CrossRef] [Google Scholar]
- Gilbert, H., Alexander, D., & Liu, R. 2007, Sol. Phys., 245, 287 [NASA ADS] [CrossRef] [Google Scholar]
- Green, L. M., Kliem, B., Török, T., van Driel-Geszotelyi, L., & Attrill, G. D. R. 2007, Sol. Phys., 246, 365 [NASA ADS] [CrossRef] [Google Scholar]
- Hood, A.W., & Priest, E.R. 1979, Solar Phys., 64, 303 [Google Scholar]
- Jess, D. B., Mathioudakis, M., Christian, D. J., et al. 2010, Sol. Phys., 261, 363 [NASA ADS] [CrossRef] [Google Scholar]
- Ji, H., Wang, H., Schmahl, E. J., Moon, Y.-J., & Jiang, Y. 2003, ApJ, 595, L135 [NASA ADS] [CrossRef] [Google Scholar]
- Jiang, Y., Yang, J., Zheng, R., Bi, Y., & Yang, X. 2009, ApJ, 693, 1851 [NASA ADS] [CrossRef] [Google Scholar]
- Joshi, B., Manoharan, P. K., Veronig, A. M., Pant, P., & Pandey, K. 2007, Sol. Phys., 242, 143 [NASA ADS] [CrossRef] [Google Scholar]
- Lemen, J. R., Title, A. M., Akin, D. J., et al. 2011, Sol. Phys., 275, 17 [Google Scholar]
- Liu, Y., Su, J., Xu, Z., et al. 2009, ApJ, 696, 70 [NASA ADS] [CrossRef] [Google Scholar]
- Manoharan, P. K., & Kundu, M. R. 2003, ApJ, 592, 597 [NASA ADS] [CrossRef] [Google Scholar]
- Moore, R. L., & LaBonte, B. J. 1980, in Solar and Interplanetary Dynamics, eds. M. Dryer, & E. Tandberg-Hanssen (Dordrecht: Reidel), 207 [Google Scholar]
- Moore, R. L., & Roumeliotis, G. 1992, in Eruptive Solar Flares, eds. Z. Svestka, B. V. Jakson, & M. E. Machado (Berlin: Springer), 69 [Google Scholar]
- Moore, R. L., Sterling, A. C., Hudson, H. S., & Lemen, J. R. 2001, ApJ, 552, 833 [NASA ADS] [CrossRef] [Google Scholar]
- Neidig, D., et al. 1998, in Synoptic Solar Physics, eds. K. S. Balasubramaniam, J. Harvey, & D. Rabin (San Francisco: ASP), ASP Conf. Ser., 140, 519 [Google Scholar]
- Pohjolainen, S., Vilmer, N., Khan, J. I., & Hillaris, A. E. 2005, A&A, 434, 329 [NASA ADS] [CrossRef] [EDP Sciences] [Google Scholar]
- Priest, E. R., & Forbes, T. G. 2002, A&ARv, 10, 313 [NASA ADS] [CrossRef] [Google Scholar]
- Rust, D. M., & LaBonte, B. J. 2005, ApJ, 622, L69 [NASA ADS] [CrossRef] [Google Scholar]
- Schou, J., Borrero, J. M., Norton, A. A., et al. 2012, Sol. Phys., 275, 327 [NASA ADS] [CrossRef] [Google Scholar]
- Schrijver, C. J. 2011, 16th Cambridge Workshop on Cool Stars, Stellar Systems, and the Sun, eds. M. J.-K. Christopher, K. B. Matthew, & A. W. Andrew (San Francisco: ASP), 448, 231 [Google Scholar]
- Shen, Y., Liu, Y., & Su, J. 2012, ApJ, 750, 12 [NASA ADS] [CrossRef] [Google Scholar]
- Srivastava, A. K., Zaqarashvili, T. V., Kumar, P., & Khodachenko, M. L. 2010, ApJ, 715, 292 [NASA ADS] [CrossRef] [Google Scholar]
- Sterling, A. C., & Moore, R. L. 2001, ApJ, 560, 1045 [NASA ADS] [CrossRef] [Google Scholar]
- Sterling, A. C., & Moore, R. L. 2004, ApJ, 613, 1221 [Google Scholar]
- Sturrock, P. A. 1989, Sol. Phys., 121, 387 [NASA ADS] [CrossRef] [Google Scholar]
- Török, T., & Kliem, B. 2005, ApJ, 630, L97 [Google Scholar]
- Williams, D. R., Török, T., Démoulin, P., van Driel-Gesztelyi, L., & Kliem, B. 2005, ApJ, 628, L163 [NASA ADS] [CrossRef] [Google Scholar]
- Woods, T. N., Hock, R., Eparvier, F., et al. 2011, ApJ, 739, 59 [Google Scholar]
- Wöger, F., von der Lühe, O., & Reardon, K. 2008, A&A, 488, 375 [NASA ADS] [CrossRef] [EDP Sciences] [Google Scholar]
All Figures
|
Fig. 1 GOES X-ray light curve (1.0−8.0 Å) of the M5.4 class flare of 6 November 2010 in NOAA 11121. The “x” symbols indicate the times of the filament eruptions. |
| In the text | |
|
Fig. 2 Simultaneous SDO/AIA, ROSA, ISOON images and SDO/HMI magnetogram of the observed erupting region. Five pink, dotted boxes in the HMI line-of-sight (LOS) magnetogram denote basic patches of positive and negative magnetic flux concentrations. The erupting filament, which is assumed to be originally located along the magnetic neutral line somewhere between regions 3 and 5, is indicated by the dashed lines in panel a). The large white boxes in the AIA 304 Å and ISOON images indicate the ROSA Hα field-of-view. The AIA 1700 Å image shows the position of two flare ribbons (marked as R1 and R2). LA1, LA2, and LA3 are three different loop arcade systems. The temporal evolution of the AIA/ISOON/ROSA data depicted in panels b)−d) and f)−h) is shown in the movie provided with the online version. |
| In the text | |
|
Fig. 3 Sequences of AIA 171 Å (panels a)−d)), 335 Å (panels f)−i) and running difference images (panels e) and j)) during the pre-eruption phase show the brightening on the top of the LA1 (referred to as the reconnection site), cancellation of LA1 and formation of the PRLA. Dotted white rectangles and arrows on panels e) and j) indicate the eruptive region and the direction of the eruption. Hα images (panels k) and l)) show filament threads (marked by white arrows) and their activation. Panels m)−o) are the time-distance diagrams of the eruptive filament as observed in the 335 Å, ROSA, and ISOON Hα lines plotted along cut 1, 2, and 3 in panels i) and k). The vertical dashed line (panels m)−o)) indicates the start time of the eruption (16:24 UT). White arrows (panels m)−o)) indicate the upward (eruptions) and downward (draining) plasma streams passing cuts 1, 2, and 3 in panels i) and k). |
| In the text | |
|
Fig. 4 Time-distance diagrams along cut 1 (see panel i of Fig. 3) show the simultaneous upward motions of the eruption and downward streams in different AIA bandpasses. The red dotted line in the top right panel is the parabolic fit to the moving features. The corresponding accelerations are also shown. The bottom panel is a time-distance diagram taken along cut 4 (see panel i) of Fig. 3), showing the downward motions of the apex plasma. |
| In the text | |
|
Fig. 5 Sequences of AIA 304 and 171 Å images showing the eruption and post-eruption evolution of the filament. The erupted material shows clear helical twist at around 16:39 UT, as seen in panels c) and c1). Time-distance plots along vertical cut 5 and 6 also illustrate twisting motions of the erupted flux ropes (panel e) and e1)). The “+” symbols in panels d) and d1) track the inverse γ-shape structure with apparent crossing of the two filament legs. |
| In the text | |
|
Fig. 6 AIA 171 and 193 Å images showing the large-scale, closed loops above the erupted flux rope at around 16:55 UT. The coresponding HMI LOS magnetogram indicates that these loops connect magnetic polarities 1 and 6 (circled). |
| In the text | |
|
Fig. 7 Simple schematic sketch of the breakout-initiation scenario for the observed eruption, showing that reconnection above the filament material between LA1 and LA3 removes the central flux system (LA1) and results in the final eruption (left and middle panels). The large-scale, asymmetric, closed, overlying magnetic loop arcade (LLA) could be the reason that the eruption is confined (right panel). |
| In the text | |
Current usage metrics show cumulative count of Article Views (full-text article views including HTML views, PDF and ePub downloads, according to the available data) and Abstracts Views on Vision4Press platform.
Data correspond to usage on the plateform after 2015. The current usage metrics is available 48-96 hours after online publication and is updated daily on week days.
Initial download of the metrics may take a while.