Fig. 4
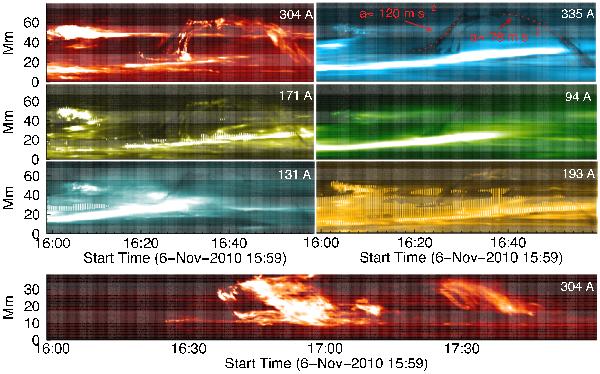
Time-distance diagrams along cut 1 (see panel i of Fig. 3) show the simultaneous upward motions of the eruption and downward streams in different AIA bandpasses. The red dotted line in the top right panel is the parabolic fit to the moving features. The corresponding accelerations are also shown. The bottom panel is a time-distance diagram taken along cut 4 (see panel i) of Fig. 3), showing the downward motions of the apex plasma.
Current usage metrics show cumulative count of Article Views (full-text article views including HTML views, PDF and ePub downloads, according to the available data) and Abstracts Views on Vision4Press platform.
Data correspond to usage on the plateform after 2015. The current usage metrics is available 48-96 hours after online publication and is updated daily on week days.
Initial download of the metrics may take a while.