Fig. 3
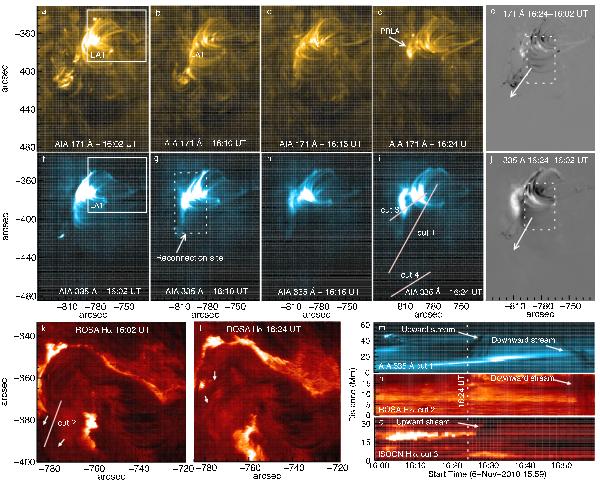
Sequences of AIA 171 Å (panels a)−d)), 335 Å (panels f)−i) and running difference images (panels e) and j)) during the pre-eruption phase show the brightening on the top of the LA1 (referred to as the reconnection site), cancellation of LA1 and formation of the PRLA. Dotted white rectangles and arrows on panels e) and j) indicate the eruptive region and the direction of the eruption. Hα images (panels k) and l)) show filament threads (marked by white arrows) and their activation. Panels m)−o) are the time-distance diagrams of the eruptive filament as observed in the 335 Å, ROSA, and ISOON Hα lines plotted along cut 1, 2, and 3 in panels i) and k). The vertical dashed line (panels m)−o)) indicates the start time of the eruption (16:24 UT). White arrows (panels m)−o)) indicate the upward (eruptions) and downward (draining) plasma streams passing cuts 1, 2, and 3 in panels i) and k).
Current usage metrics show cumulative count of Article Views (full-text article views including HTML views, PDF and ePub downloads, according to the available data) and Abstracts Views on Vision4Press platform.
Data correspond to usage on the plateform after 2015. The current usage metrics is available 48-96 hours after online publication and is updated daily on week days.
Initial download of the metrics may take a while.