Fig. 2
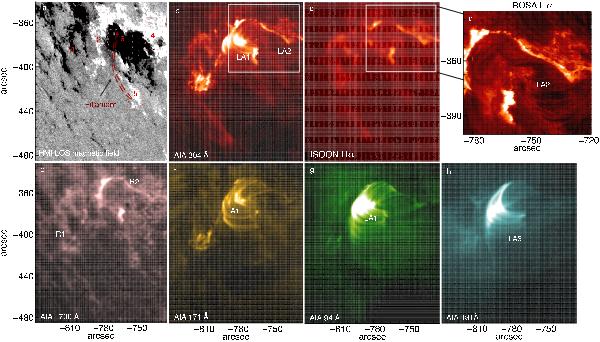
Simultaneous SDO/AIA, ROSA, ISOON images and SDO/HMI magnetogram of the observed erupting region. Five pink, dotted boxes in the HMI line-of-sight (LOS) magnetogram denote basic patches of positive and negative magnetic flux concentrations. The erupting filament, which is assumed to be originally located along the magnetic neutral line somewhere between regions 3 and 5, is indicated by the dashed lines in panel a). The large white boxes in the AIA 304 Å and ISOON images indicate the ROSA Hα field-of-view. The AIA 1700 Å image shows the position of two flare ribbons (marked as R1 and R2). LA1, LA2, and LA3 are three different loop arcade systems. The temporal evolution of the AIA/ISOON/ROSA data depicted in panels b)−d) and f)−h) is shown in the movie provided with the online version.
Current usage metrics show cumulative count of Article Views (full-text article views including HTML views, PDF and ePub downloads, according to the available data) and Abstracts Views on Vision4Press platform.
Data correspond to usage on the plateform after 2015. The current usage metrics is available 48-96 hours after online publication and is updated daily on week days.
Initial download of the metrics may take a while.