Fig. 5
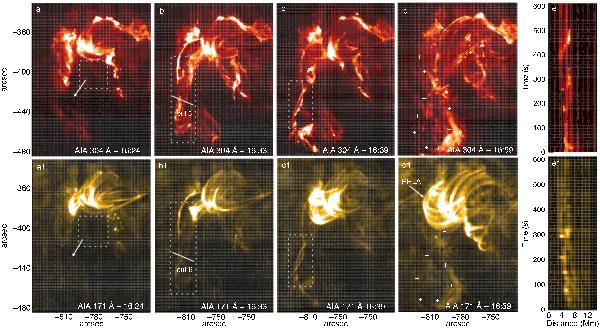
Sequences of AIA 304 and 171 Å images showing the eruption and post-eruption evolution of the filament. The erupted material shows clear helical twist at around 16:39 UT, as seen in panels c) and c1). Time-distance plots along vertical cut 5 and 6 also illustrate twisting motions of the erupted flux ropes (panel e) and e1)). The “+” symbols in panels d) and d1) track the inverse γ-shape structure with apparent crossing of the two filament legs.
Current usage metrics show cumulative count of Article Views (full-text article views including HTML views, PDF and ePub downloads, according to the available data) and Abstracts Views on Vision4Press platform.
Data correspond to usage on the plateform after 2015. The current usage metrics is available 48-96 hours after online publication and is updated daily on week days.
Initial download of the metrics may take a while.