| Issue |
A&A
Volume 551, March 2013
|
|
|---|---|---|
| Article Number | A62 | |
| Number of page(s) | 12 | |
| Section | Interstellar and circumstellar matter | |
| DOI | https://doi.org/10.1051/0004-6361/201220553 | |
| Published online | 22 February 2013 | |
Exploring the circumstellar environment of the young eruptive star V2492 Cygni⋆,⋆⋆
1 Research and Scientific Support Department, European Space Agency (ESA, ESTEC, SRE-SA), PO Box 299, 2200 AG, Noordwijk, The Netherlands
e-mail: This email address is being protected from spambots. You need JavaScript enabled to view it.
2 Konkoly Observatory, Research Centre for Astronomy and Earth Sciences, Hungarian Academy of Sciences, PO Box 67, 1525 Budapest, Hungary
3 Instituto de Astrofísica de Canarias, 38200 La Laguna, Tenerife, Spain
4 Departamento de Astrofísica, Universidad de La Laguna, 38205 La Laguna, Tenerife, Spain
5 Max-Planck-Institut für Astronomie, Königstuhl 17, 69117 Heidelberg, Germany
6 Department of Astronomy, Loránd Eötvös University, Pázmány P. st. 1/A, 1117 Budapest, Hungary
7 ELTE Gothard − Lendület Research Group, 9700 Szombathely, Hungary
8 Jet Propulsion Laboratory, California Institute of Technology, Pasadena, CA 91109, USA
Received: 13 October 2012
Accepted: 3 January 2013
Abstract
Context. V2492 Cyg is a young eruptive star that went into outburst in 2010. The near-infrared color changes observed since the outburst peak suggest that the source belongs to a newly defined sub-class of young eruptive stars, where time-dependent accretion and variable line-of-sight extinction play a combined role in the flux changes.
Aims. In order to learn about the origin of the light variations and to explore the circumstellar and interstellar environment of V2492 Cyg, we monitored the source at ten different wavelengths, between 0.55 μm and 2.2 μm from the ground and between 3.6 μm and 160 μm from space.
Methods. We analyze the light curves and study the color−color diagrams via comparison with the standard reddening path. We examine the structure of the molecular cloud hosting V2492 Cyg by computing temperature and optical depth maps from the far-infrared data.
Results. We find that the shapes of the light curves at different wavelengths are strictly self-similar and that the observed variability is related to a single physical process, most likely variable extinction. We suggest that the central source is episodically occulted by a dense dust cloud in the inner disk and, based on the invariability of the far-infrared fluxes, we propose that it is a long-lived rather than a transient structure. In some respects, V2492 Cyg can be regarded as a young, embedded analog of UX Orionis-type stars.
Conclusions. The example of V2492 Cyg demonstrates that the light variations of young eruptive stars are not exclusively related to changing accretion. The variability provided information on an azimuthally asymmetric structural element in the inner disk. Such an asymmetric density distribution in the terrestrial zone may also have consequences for the initial conditions of planet formation.
Key words: stars: formation / circumstellar matter / infrared: stars / stars: individual: V2492 Cyg
This work is based on observations made with the Herschel Space Observatory and with the Spitzer Space Telescope. Herschel is an ESA space observatory with science instruments provided by European-led Principal Investigator consortia and with important participation from NASA. Spitzer is operated by the Jet Propulsion Laboratory, California Institute of Technology under a contract with NASA.
Tables 1 and 2 are available in electronic form at http://www.aanda.org
ESA fellow.
© ESO, 2013
1. Introduction
Young eruptive stars, defined by their rapid and powerful brightening in optical and infrared light, form a subclass of Sun-like pre-main sequence objects. The eruptions of the well-studied classical FU Orionis- and EX Lupi-type stars are believed to be due to enhanced accretion from the circumstellar disk onto the star (Hartmann & Kenyon 1996). According to the current picture, the inward spiraling material piles up close to the inner edge of the accretion disk and falls onto the stellar surface as a result of a gravitational and thermal instability (Zhu et al. 2009). This runaway accretion model, however, may not explain all eruptive events. Recent studies of some young eruptive stars suggest that the flux changes of these systems are due to the combination of two effects of comparable amplitude. One effect is an intrinsic brightening related to the appearance of a new, accretion-fueled hot component in the system, while the other is a dust-clearing event that reduces the extinction along the line of sight (see, e.g., V1647 Ori in Reipurth & Aspin 2004 and Acosta-Pulido et al. 2007; or PV Cep in Kun et al. 2011). The simultaneity of the accretion and extinction changes suggests that they might be physically linked, and it is the changing accretion luminosity that causes changes in the inner disk structure. Such rearrangements of the inner disk have a potentially high importance for the evolution of the terrestrial zone of circumstellar disks.
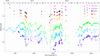 |
Fig. 1 Light curves of V2492 Cyg. Filled dots are from Paper I and this work, asterisks are from Covey et al. (2011), Aspin (2011), and from the AAVSO database (http://www.aavso.org). For clarity, the V, I, J, H, KS, [3.6], and [4.5] light curves are shifted along the y axis. Downward arrows indicate 3σ upper limits (this work). Tick marks on the top indicate the first day of each month. Vertical dashed line marks the epoch when our WHT/LIRIS spectum was taken. |
V2492 Cyg (also known as VSX J205126.1+440523, IRAS 20496+4354, and PTF 10nvg) is a recently discovered, young eruptive star that may show another example of extinction-related flux changes. The source is located in the Pelican Nebula, at a distance of 550 pc (Straizys et al. 1989; Bally & Reipurth 2003). It brightened by 1.8 mag in unfiltered light between 2009 December and 2010 June, but Digitized Sky Survey plates show that it had been several magnitudes fainter in quiescence (Itagaki & Yamaoka 2010; Munari et al. 2010). Light curves presented in Covey et al. (2011) and Kóspál et al. (2011, hereafter Paper I) indicated that the star reached maximum brightness at the end of 2010 August, then showed a fast decline, making its light curve very similar to that of the outburst of EX Lup in 2008 (Ábrahám et al. 2009). However, further monitoring revealed that the outburst is not over yet: V2492 Cyg started to brighten again at the end of 2010. Changes in the near-infrared colors suggested that the initial brightening leading to the peak in 2010 August was probably due to the combination of increasing accretion and decreasing extinction. However, subsequent flux variations mostly followed the standard interstellar reddening path, indicating that after the peak, changing extinction was largely responsible for the observed variability (Paper I, Aspin 2011). This makes V2492 Cyg remarkably similar to V1647 Ori and PV Cep, but with an unprecedentedly large amplitude in the AV changes. Further photometric and spectroscopic monitoring of the object is presented in Hillenbrand et al. (2013).
In this paper, we present new optical, near-infrared, mid-infrared, and far-infrared monitoring observations, as well as a near-infrared spectrum of V2492 Cyg. In Sect. 2 we summarize the observations, in Sect. 3 we present light curves, color − color and color − magnitude diagrams, multi-epoch spectral energy distributions (SEDs), and the near-infrared spectrum, as well as our far-infrared results on the source and its surroundings. In Sect. 4 we discuss the physical origin of the flux variations, and in Sect. 5 we summarize our conclusions about the nature and circumstellar environment of V2492 Cyg.
2. Observations and data reduction
We obtained optical and near-infrared images with VRIJHKS filters between 2010 September 19 and 2012 October 12 using four telescopes: the Schmidt and RCC telescopes of the Konkoly Observatory (Hungary), as well as the IAC-80 and Telescopio Carlos Sánchez (TCS) telescopes of the Teide Observatory in the Canary Islands (Spain). Technical details of the telescopes and their instrumentation are described in Paper I. Reduction of the images and aperture photometry were performed in the same way as in Paper I. The resulting magnitudes for the period between 2010 September 19 and 2011 January 2 are presented in Paper I, while the rest are listed in Table 1 and plotted in Fig. 1.
We observed V2492 Cyg using the Spitzer Space Telescope in the post-helium phase at eight epochs between 2011 September 8 and 2012 September 16 (PID: 80165, PI: P. Ábrahám). We used the IRAC instrument at 3.6 and 4.5 μm in subarray mode. The data reduction procedures were the same as described in detail in Kun et al. (2011). Fluxes were color corrected by convolving the IRAC filter profiles with the observed SED in an iterative way. The results of the photometry are listed in Table 2.
We conducted a four-epoch far-infrared monitoring of V2492 Cyg with the Herschel Space Observatory between 2011 October 29 and 2012 January 11 (PID: DDT_akospal_2, PI: Á. Kóspál). We used the Photodetector Array Camera and Spectrometer (PACS) instrument (Poglitsch et al. 2010) in mini-scan map mode with medium scan speed (20′′ s-1) at 70 μm and 160 μm. Two scan maps with orientations of 70° and 110° with respect to the detector array were performed at each epoch. We used eight scan legs in each map with a 4′′ separation between them, and the length of the scan legs was 3 0. The dates were scheduled so that the Spitzer and the Herschel observations were executed within two days of each other. Additionally, we obtained 100 μm and 160 μm photometry with PACS, as well as 250, 350, and 500 μm images with the Spectral and Photometric Imaging Receiver (SPIRE, Griffin et al. 2010) at one single epoch. The PACS maps were taken in the same observation setup as described above. The SPIRE observations were performed in the small map mode, the repetition factor was set to 1.
Due to the extended emission surrounding V2492 Cyg, special care was taken when extracting photometry. In order to remove the background from the PACS images, we used the “boloSource()” routine (Vavrek et al., in prep.). This algorithm has been developed to subtract point- and compact sources from the diffuse background of large-scale galactic maps observed with the PACS and SPIRE photometers. Unlike other algorithms working on the projected Level 2 maps, it takes Level 2 masks around pre-identified sources, which are then back-projected onto the Level 1 detector pixel timeline. These timeline segments are interpolated at spatial frequencies adjusted to the source size (for a point source this is variable with scan speed). The precise size and position of the Level 1 mask are further optimized on the timeline to ensure that the interpolation happens over the most significant sequence of frames for each individual pixel and for any specific source. The interpolator first simulates the high-frequency part of the flux-calibrated signal timeline (that includes correlated noise, instrument 1/f noise, and extended background sky emission) with a power spectrum similar to that measured on a single scan-leg. In a second step, this synthetic noise component is added to a baseline estimate (low-frequency component) at the position of masked frames, resulting in an interpolated signal in the detector timeline without the presence of masked sources. The background-removed timeline can then be created by subtracting the interpolated timeline from the original timeline. The projection of such a timeline provides an image containing the sources only, without any contribution from the sky background.
To make reliable maps of the extended emission seen in the Herschel PACS and SPIRE images, we used scanamorphos (Roussel 2012), a software developed especially for the purpose of computing maps from scan observations by taking into account the redundancy of the data. We found that the maps produced by scanamorphos contain less striping and result in smoother images than those produced by the Herschel interactive processing environment (HIPE, Ott 2010).
We used the background-subtracted PACS images to obtain aperture photometry for V2492 Cyg and another point source in the field, HH 570, by averaging flux values calculated for aperture radii between 5′′ and 10′′ at 70 μm and between 14′′ and 19′′ at 160 μm (due to the source being marginally resolved, see also Sect. 3.6). At 70 μm, we note that a faint source is detected at a distance of 9 9 from V2492 Cyg (see also Sect. 3.7), but the contamination to the photometry is less than 3%. We applied aperture corrections given in Müller et al. (2011). In order to achieve the highest photometric accuracy and cancel out any remaining systematic calibration artifacts, we determined the flux of V2492 Cyg relative to HH 570. For HH 570, the average of the four epochs provided a flux value of 4.87 ± 0.18 Jy at 70 μm and 9.60 ± 0.52 Jy at 160 μm. We estimated uncertainties by taking into account the formal error of the aperture photometry, the uncertainty of the absolute flux calibration (3%, 3%, and 5% at 70, 100, and 160 μm respectively, see Müller et al. 2011), the uncertainty of the photometry of HH 570, and the uncertainty in the background subtraction. Data analysis of SPIRE maps was performed in HIPE v. 9.0.0, working on the pipeline-processed products. Following the recommendation of the SPIRE Data Reduction Guide, we used the sourceExtractorTimeline task (formerly known as Timeline Fitter) to obtain photometry for V2492 Cyg. This algorithm works on the Level 1 baseline-subtracted timeline data rather than on the final maps. The task subtracts a 2-degree polynomial baseline from the individual scans and fits a Gaussian to the source. V2492 Cyg is situated in a region with a relatively bright and inhomogeneous background emission. Although we did what we could to eliminate the background by doing photometry on the background-subtracted PACS maps and fitting Gaussians in the timeline data for SPIRE, uncertainty in the background estimation dominates the final photometric error. We color-corrected the Herschel fluxes by convolving the PACS and SPIRE filter profiles with the observed SED in an iterative way. The final Herschel fluxes and uncertainties for V2492 Cyg are listed in Table 2.
We observed V2492 Cyg with the LIRIS instrument installed on the 4.2 m William Herschel Telescope (WHT) at the Observatorio del Roque de Los Muchachos (Spain). The description of the instrument can be found in Acosta-Pulido et al. (2007). On 2011 July 21/22 JHKS images were taken, while on 2011 August 1/2 long-slit intermediate resolution spectra in the ZJ and HK bands were obtained. The images were taken in a 5-point dither pattern, with 5 s of exposure time per dither position. The spectra were taken in an ABBA nodding pattern with a total exposure time of 600 s and 336 s in the ZJ and HK bands, respectively. We used the 075 slit width, which yielded a spectral resolution of R = 550−700 in the 0.9−2.4 μm range. We observed HIP 103694, a G2-type star, as telluric calibrator. The data reduction of both the images and the spectra were done in the same way as in Acosta-Pulido et al. (2007). The spectra were flux calibrated using JHKS photometry taken with TCS on 2011 August 3/4. The typical signal-to-noise ratio of the spectra is 5, 25, and 50 in the J, H, and KS bands, respectively. The photometry is included in Table 1, while the spectra are plotted in Fig. 5.
V2492 Cyg was observed by the Wide-field Infrared Survey Explorer (WISE; Wright et al. 2010) on 2010 May 27 − 28. This measurement was taken during the cryogenic phase and is presented in the WISE All-Sky Database. For the W1, W2, and W3 filters, 12 − 16% of the pixels were saturated. While in most cases the profile-fitting algorithm of WISE producing flux estimates from the unsaturated pixels works very well, there is a pronounced flux-overestimation bias for the W2 filter in case of sources brighter than W2 = 6.5 mag. Using the curve in Fig. 8 of Sect. 6.3 of the Explanatory Supplement to the WISE All-Sky Data Release Products (Cutri et al. 2012), we corrected for this bias. Then, we converted the magnitudes to fluxes and color-corrected them by convolving the WISE filter profiles with the observed SED in an iterative way. In the errors, we added in quadrature 2.4%, 2.8%, 4.5%, and 5.7% as the uncertainty of the absolute calibration in the W1, W2, W3, and W4 bands, respectively (Sect. 4.4 of the Explanatory Supplement). The resulting fluxes are F3.353 μm = 1.36 ± 0.07 Jy, F4.603 μm = 2.40 ± 0.10 Jy, F11.561 μm = 4.90 ± 0.22 Jy, and F22.088 μm = 7.67 ± 0.45 Jy.
3. Results and analysis
3.1. Light curves
Using our measurements from Tables 1 and 2, along with data from the literature (including Paper I) and from the AAVSO database, we plotted light curves of V2492 Cyg taken with eight different filters between 0.55 and 4.5 μm (Fig. 1). As the R-band light curve shows, the peak of the outburst occurred in 2010 around the end of August or beginning of September. The highest J, H, KS, and 3.4−3.8 μm fluxes were also detected in 2010 September. The well-sampled optical light curves show that the object has been alternating between fading and brightening with amplitudes of several magnitudes, and no general fading trend can be seen. An exceptionally deep dip occurred around 2011 June−July, when the I-band flux dropped by an unprecedented 7 mag. In 2011 November, the source reached an R-band brightness only ≈2 mag below the outburst peak in 2010 August. In 2011 mid-December, V2492 Cyg started a rapid fading, decreasing by at least 6 mag in I-band, then remained invisible for our telescopes for several months. Photometry from 2012 indicates brightening and another peak in the light curves at the end of 2012 August, when the source became almost as bright as at maximum. According to both our latest measurements from 2012 October and optical observations from the AAVSO data base until the end of 2012, V2492 Cyg is currently fading again. Analyzing optical observations of Covey et al. (2011) taken between 2010 May and November, Aspin (2011) found multiple brightness peaks with an ≈ 100 day period. Our data in Fig. 1 exhibit several different variability timescales, the longest one suggested by the two local peaks in 2011 November and 2012 August. On shorter timescales, between 2011 August and December, the source seems to show ≈20-day-long quasi-periodic cycles. Recently, Hillenbrand et al. (2013) presented well-sampled JHKs light curves and claimed to have found a 221-day period.
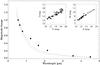 |
Fig. 2 Magnitude changes of V2492 Cyg relative to the V-band. Interstellar reddening for RV = 3.1 is overplotted with dotted line and for RV = 5.0 with dashed line (Cardelli et al. 1989). The small insets show examples for scatter plots from which the relative magnitude changes were determined as the slope of the fitted lines. |
The near- and mid-infrared light curves show a remarkable similarity in shape to the optical ones, albeit with a lower amplitude. By correlating the different light curves, we can exclude any time lags larger than a few days between them. In order to quantify the variability amplitudes as a function of wavelength, we produced I vs. V, R vs. I, J vs. I, H vs. J, KS vs. J, [3.6] vs. KS, and [4.5] vs. [3.6] scatter plots, always using only those data points for each plot that were obtained on the same night. Two example plots can be seen as small insets in Fig. 2. The scatter plots could be well fitted with linear relationships, no matter whether the source was fading or brightening. The slopes of the lines, plotted in Fig. 2, determine the variability amplitudes relative to the V-band (0.871 ± 0.031, 0.709 ± 0.038, 0.521 ± 0.057, 0.354 ± 0.048, 0.214 ± 0.037, 0.073 ± 0.030, 0.046 ± 0.024 for R, I, J, H, KS, [3.6], and [4.5], respectively). The amplitudes monotonically decrease towards longer wavelengths, more steeply at optical wavelengths than in the infrared. At 4.5 μm, the flux changes are only 5% of those in the V-band, but are still very well detected.
3.2. Herschel monitoring
In order to check whether photometric variability can be seen at far-infrared wavelengths, we compared the Herschel fluxes of V2492 Cyg measured at four different epochs (Table 2). Our data reveal that the peak-to-peak variability of the source is less than 0.6 Jy (4%) at 70 μm, and less than 0.8 Jy (5%) at 160 μm. These limits are comparable to or less than the uncertainty of the individual flux measurements, we thus conclude that V2492 Cyg did not show significant flux changes in the far-infrared between 2011 October and 2012 January.
3.3. Color − color and color − magnitude diagrams
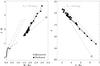 |
Fig. 3 Color − color and color–magnitude diagrams of V2492 Cyg. The open circle represents quiescent (2006) data from Paper I, while filled dots mark observations taken in 2010 − 2012 from Paper I and from this work. The main sequence is marked by a thick solid line, the giant branch with a dotted line (Koornneef 1983), the reddening path for RV = 3.1 with dashed lines (Cardelli et al. 1989), and the T Tauri locus with a dash-dotted line (Meyer et al. 1997). |
Based on photometry from 2010, we presented a J − H vs. H − KS color − color diagram in Paper I. We found that the source was very red before the outburst, was bluest at the peak of the outburst, and started fading approximately along the reddening path (see also Aspin 2011). Our new data from 2011−2012 confirm that all color changes happened along a well-defined line, with a slope of 1.40 ± 0.04, that was close to, but somewhat different from, the value of 1.78 representative for the standard interstellar reddening (Fig. 3, left). Figure 3, right, suggests that the relative changes in the J and Ks bands are fully consistent with the extinction law; thus the difference in the color−color diagram is related to larger-than-expected changes in the H band with respect to the reddening law. If the near-infrared magnitude changes were caused by changing extinction, then the difference in AV between the peak of the outburst and our faintest observation in 2011 July would be about 20 mag. We note that Hillenbrand et al. (2013) observed the source at an even fainter state, indicating that the full range of extinction changes can be even higher. Remarkably, the faintest colors from 2010 − 2012 are still significantly different from the quiescent colors measured in 2006. The J vs. J − KS color − magnitude diagram (Fig. 3, right) shows that not only the colors, but also the magnitude changes follow the reddening path, suggesting the same ΔAV ≈ 20 mag. This is different from what was observed for V1647 Ori, where the color changes were consistent with reddening, but the magnitudes required additional color-independent flux changes as well (Acosta-Pulido et al. 2007).
At optical wavelengths, the distribution of data points in the V − R vs. R − I and the I vs. V − I diagrams are also consistent with changing extinction. At the Spitzer wavelengths, the [3.6] vs. [3.6]−[4.5] diagram also follows very precisely the reddening path. However, the extinction changes indicated by the optical and mid-infrared data are significantly smaller than the corresponding value estimated at near-infrared wavelengths: only ≈13 mag instead of ≈20 mag between the peak and 2011 July. This discrepancy is reflected in Fig. 2, where the relative magnitude changes at the JHKS bands are higher than the extinction curves fitted to the optical and the Spitzer data points.
3.4. Spectral energy distributions
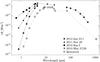 |
Fig. 4 Multi-epoch SEDs of V2492 Cyg. Open circles represent quiescent data from Paper I and references therein, except for the 1100 μm point, which is from Aspin (2011). Although these points are not contemporaneous, we connected them with a dotted line to guide the eye. Filled symbols show outburst observations at four different epochs. Data from 2010 May are from the WISE catalog, data from 2010 September are from Covey et al. (2011) and Aspin (2011), and data from 2011 − 2012 are from this work. |
The quiescent SED (open circles in Fig. 4) resembles that of a moderately reddened embedded Class I source, with a bolometric luminosity of 14 L⊙ and bolometric temperature of 280 K (Paper I; Covey et al. 2011; Aspin 2011). For the outburst period, we plotted several SEDs, snapshots of the system in different brightness states. Although we do not have a complete contemporaneous SED measured at peak brightness in 2010 August, we can attempt to construct a reasonable approximation of it by simply taking the “upper envelope” of the data points plotted in Fig. 4. For the shortest wavelengths, we take the 2010 September data, which were observed close to the peak. For the mid-infrared part, we take the WISE data from 2010 May because the R-band light curve shows that the source was in a very similar brightness state in 2010 May and in 2010 September. For the long-wavelength part, we take the Herschel data from 2012 January because our Herschel monitoring (Sect. 3.2) showed that the source has a constant flux at ≥70 μm, independent of the actual optical brightness. Integrating this upper envelope, the resulting bolometric luminosity and temperature are 43 L⊙ and 570 K, respectively.
Comparing the quiescent SED with the upper envelope SED (i.e., the SED representative of the peak brightness), it is evident that an extra emission component appeared in the system that caused brightening in the whole optical-to-far-infrared regime, even at 70 μm. Such an outburst component was observed in a number of eruptive objects, such as OO Ser (Kóspál et al. 2007), V1647 Ori (Muzerolle et al. 2005), and EX Lup (Juhász et al. 2012). Assuming that this component is located in the center of the system, it is probably reddened by both circumstellar and interstellar extinction. We took the difference of the quiescent and the 2010 September SED between 1.25 and 3.8 μm and dereddened it by different values in the 6−12 mag range (Covey et al. 2011). We found that, irrespective of the applied dereddening, the outburst component seems to have a temperature distribution rather than a single temperature blackbody (as opposed to EX Lup or HBC 722, Juhász et al. 2012; Kóspál et al. 2011).
The multi-epoch SEDs plotted for the outburst period deviate from each other in the optical and near-infrared regime, but converge to the same flux level in the mid-infrared. This behavior suggests that the temperature and the emission of the disk, and thus its heating via irradiation by the central source or the release of accretion energy, was nearly constant during the outburst. However, the intrinsically constant light curve of the source is intermittently modulated by various amounts of fading. As we discussed in Sect. 3.3, this modulation is probably related to changing extinction along the line of sight.
3.5. Spectroscopy
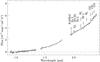 |
Fig. 5 Flux-calibrated ZJ and HK spectra of V2492 Cyg taken on 2011 August 1 with LIRIS on the WHT. |
The ZJ and HK spectra in Fig. 5 were taken on 2011 August 1, when V2492 Cyg was rapidly brightening, but was still close to its faintest detected state (see the dashed line in Fig. 1). The source was practically undetected below 1.1 μm, then the spectrum steeply rose towards longer wavelengths. The J and H bands show a smooth continuum, no lines are visible within the measurement uncertainties. The K band, however, shows some emission features, notably the CO bandhead, two H2 lines, and some marginally detected metallic lines. No atomic hydrogen lines are present. JHK spectra were also obtained by Covey et al. (2011) in 2010 July 14 and 18, as well as by Aspin (2011) in 2010 October 2−3 and 2010 November 26−27. Our spectrum differs in many ways from the earlier spectra. While the Brackett and Paschen series were conspicuous in 2010, they are absent in our spectrum. We estimate a 1σ upper limit of 4 × 10-15 erg s-1 cm-2 for the flux of the Br γ line. The CO bandhead emission also became fainter, but is still detected in our spectrum. The equivalent width (EW) and the flux integrated between 2.293 μm and 2.300 μm are −4.5 Å and 2.2 × 10⁻¹⁴ erg s-1 cm-2, respectively. This is a factor of 2−6 decrease in EW and a factor of 3−19 decrease in flux. We note that we did not apply any reddening correction to the line fluxes.
Interestingly, the H2 lines in the K band exhibit a different behavior. The lines at 2.12 μm and 2.22 μm have EWs of −6.7 Å and −1.4 Å and fluxes of 2.5 × 10⁻¹⁴ erg s-1 cm-2 and 6.1 × 10⁻¹⁵ erg s-1 cm-2, respectively. This means that the fluxes of the H2 lines became 1.1 − 2.5 times stronger than in 2010, while the ratio of the 2.12 μm line to the 2.22 μm line stays roughly constant over the different epochs. The ratio, which is equal to 4.1 for our spectrum, is close to the theoretical value of 4.4 for C shocks computed by Smith (1995). This suggests that, as opposed to the H I lines and the CO bandhead, the H2 lines are not originating from close to the central star, but farther from it, probably from a jet.
Hillenbrand et al. (2013) present several spectra taken in 2011. Three of them were observed close in time (2011 June 26, July 15, and August 17) to our 2011 August 1 spectrum. The absolute flux level of our spectrum is most similar to their 2011 June 26 spectrum, while the features resemble those seen in their 2011 August 17 spectrum.
3.6. Spatial extent of V2492 Cyg
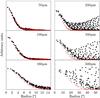 |
Fig. 6 Pixel values as a function of distance from the source centroid for the background-subtracted PACS images taken on 2011 November 29 and for the SPIRE images taken on 2012 January 3 (black dots). Red dots were obtained in a similar way, but using observations of α Boo for PACS and the official beam profiles for SPIRE. |
In the following, we will determine whether the circumstellar matter around V2492 Cyg is resolved at any Herschel wavelength. In Fig. 6 we plotted the pixel values of the background-subtracted PACS images from 2011 November 29 as a function of distance from the source centroid. The points can be well fitted using Gaussians with full widths at half maximum (FWHMs) of 5 4, 6
4, 6 5, and 11
 4 at 70, 100, and 160 μm, respectively. As a point spread function (PSF) standard, we reduced observations of α Boo the same way as we reduced our V2492 Cyg observations and overplotted the obtained pixel values on the same graphs. Figure 6 shows that while the source is unresolved at 70 μm, it is marginally resolved at longer wavelengths. We calculated by how much the PSF needs to be broadened to reproduce the observed profiles. From this, we could derive an upper limit for the deconvolved size of < 11 ( < 580 AU) at 70 μm and deconvolved sizes of 21 (1200 AU) at 100 μm and 49 (2700 AU) at 160 μm. The PACS images taken during the three other epochs give identical results. We also fitted 2D Gaussians to the PACS images. The obtained major axes are on average 58, 76, and 130, confirming our earlier findings.
Figure 6 also shows the pixel values measured on our SPIRE images from 2012 January 3. Because we did not attempt to perform any background subtraction, several points deviate from a Gaussian profile due to large-scale extended emission. Here we used the official SPIRE beam profiles provided for a 1′′ resolution at the Herschel Science Centre calibration ftp site, resampled them to the same pixel size as our V2492 Cyg observations, and overplotted them on the same figure. In order to estimate the size of our source, we again broadened the PSFs until we could reproduce the lower envelope of the data points measured for V2492 Cyg. The resulting deconvolved sizes are 153 (8400 AU) at 250 μm and 200 (11 000 AU) at 350 μm. The contrast between the source and the surrounding extended emission is so low at 500 μm that no reasonable size estimate could be done.
3.7. The broader environment of V2492 Cyg
 |
Fig. 7 False-color composites depicting the environment of V2492 Cyg. Each image shows the same 3′ × 3′ area. The two leftmost images are linearly scaled, the two rightmost ones are logarithmically scaled. The V, R, I composite was constructed by shifting and co-adding several exposures taken with the Schmidt telescope at Konkoly Observatory, obtained between 2011 November 1 − 30. The J, H, KS composite was obtained with the WHT on 2011 July 22. The 70, 100, 160 μm composite uses all Herschel/PACS images taken between 2011 October 29 and 2012 January 11. The 250, 350, 500 μm composite is made of Herschel/SPIRE images taken on 2012 January 3. Gray × symbols mark the position of V2492 Cyg (α2000 = 20h51m26 |
V2492 Cyg sits at the tip of a dark cloud that blocks out almost every background star at optical wavelengths (Fig. 7). Because this cloud is illuminated from the east and emits at Hα (Bally & Reipurth 2003), the rim of the cloud is visible in our R band images, but not in the V or I bands. Interestingly, the rim is also faintly visible in the J, H, and KS bands. Due to the lower extinction at infrared wavelengths compared to the optical, background stars appear behind the cloud in the JHKS images, making it possible to estimate interstellar extinction in the vicinity of V2492 Cyg. Using the 2MASS magnitudes of the brightest stars as calibrators, we obtained photometry for every point source brighter than J = 20.5 mag in the UKIDSS JHKS images (Kóspál et al. 2011) in an area of 3′ × 3′ centered on V2492 Cyg. Then, we dereddened the sources using the reddening law from Cardelli et al. (1989) so that they fall on the main sequence. We found that stars behind the dark cloud typically have reddenings in the AV = 10−20 mag range, while outside the cloud, stars are typically reddened by only AV = 1−10 mag.
Moving to longer wavelengths, the cloud that is dark at optical and infrared wavelengths starts emitting its own thermal radiation (see the Herschel images in Fig. 7). Using the convolution kernels of Gordon et al. (2008), we convolved each Herschel image to the resolution of the SPIRE 500 μm images and then fitted a modified blackbody to the observed SED for each map pixel. We used a fixed powerlaw index of the dust opacity coefficient β = 2 (assuming a dust opacity law of κ ∝ λ − β), appropriate for the diffuse interstellar medium (Draine 2006). We found that the temperature across the cloud is rather homogeneous (between 15 and 18 K), coldest in the central parts and increasing towards the edge of the cloud. This temperature is typical of dense molecular clouds (e.g., Stahler & Palla 2005). Using our temperature map and assuming optically thin emission, we calculated the optical depth in the cloud and found values up to τ160 = 0.01. Taking 3000 mag as a typical ratio between the extinction in the V-band and the optical depth at 160 μm (Kiss et al. 2006), this optical depth translates to AV = 30 mag in the densest parts of the cloud, which is roughly consistent with what we obtained from dereddening background stars.
Bally & Reipurth (2003) reported the detection of several Herbig-Haro objects in the Pelican Nebula. HH 569 is a bright bow shock supposedly originating from V2492 Cyg. This object must only emit in shock lines like [SII] because it is not visible either in our broad band VRIJHKS images or in our Herschel images. According to Bally & Reipurth (2003), HH 570 S, HH 570, and HH 570 N form a single, highly collimated flow, with no infrared point sources cataloged along it. While we do not detect the southern and northern parts, the central part, HH 570, is well visible in all our images. In the J, H, and KS bands, the object seems to consist of a central point source, a slightly curved conical nebula extending to about 5′′ to the north, and a narrow southern nebula similar in size but separated by a dark area from the central point source. We note that this object, henceforth HH 570 IRS (α2000 = 20h51m22 85, δ2000 = 44°04′2951), has not been mentioned in the literature before. The morphology suggests that the source is likely a deeply embedded young stellar object surrounded by a bipolar reflection nebula. HH 570 IRS is also well visible as a point source in our Herschel/PACS images. This source may very well be the driving source of HH 570 S and HH 570 N.
Interestingly, another faint point source also appears in our PACS 70 μm images in the vicinity of V2492 Cyg. This source is located at a distance of 99 to the west of V2492 Cyg (PA of 243°) and is only visible at 70 μm. The brightness contrast between them is about 30. The faint source is not detected at any other wavelengths. It may be an infrared companion to V2492 Cyg or an unrelated background object.
4. Discussion
In the following, we discuss what we can learn about the origin of light variations in V2492 Cyg. In Sect. 3.1 we showed that the light curves in Fig. 1 have practically identical shapes, although with different variability amplitudes, at all wavelengths between 0.55 and 4.5 μm. This result and the fact that no time delays can be observed between the different curves suggest a single physical mechanism behind the variability. One possibility would be that the luminosity of the outbursting central source changes in time due to variable accretion, and this varying illumination causes changes in the thermal emission of the disk. This explanation, however, is unlikely because in Sect. 3.4 we concluded, partly on the basis of our Herschel monitoring program, that the intrinsic brightness of the central source has been nearly constant since the peak brightness in 2010 August. Moreover, a varying central illumination would result in more wavelength-independent brightness changes than observed. In addition, it might result in time delays at longer wavelengths with respect to the changes in the optical light curve (see, e.g., the case of OO Ser in Kóspál et al. 2007 and V1647 Ori in Muzerolle et al. 2005; Mosoni et al. 2013). Based on our observations, we think that the picture of time-dependent obscuration of the central part of the system by an orbiting dust cloud in a nearly edge-on disk is more likely, both because the color changes follow the extinction curve of Cardelli et al. (1989) and because there is a lack of time delay between the light curves. Concerning its physics, this scenario is the same as the one used to explain the minima of UX Orionis-type stars (UXors), isolated Herbig stars showing sporadic 1 − 3 mag fadings lasting for weeks (Grinin et al. 1991; Eaton & Herbst 1994). We will adopt this explanation for the forthcoming discussions.
To test the plausibility of the orbiting dust cloud scenario, we will first check if the orbital velocity of the cloud is consistent with the assumed Keplerian velocity field. Following the method used by van Boekel et al. (2010) for T Tau S, we will assume that the measured 4.5 μm brightness comes from a 1500 K blackbody. Considering that V2492 Cyg faded by Fν = 0.17 Jy at 4.5 μm within 6.8 days, between 2012 January 4 and 11, the minimum solid angle of the region that was covered is Ω = Fν/Bν(1500 K) ≈ 3 × 10-18 sr. This corresponds to a diameter of 0.2 AU if the emitting region is circular. The velocity required to obscure such an area in 6.8 days is 55 km s-1. This is not an unreasonable value, since the Keplerian velocity around a star of 0.4 M⊙ at a radius of 0.1 AU would be 55 km s-1. Even if the 4.5 μm emission originates from the disk region somewhat cooler than the assumed 1500 K due to a radially decreasing temperature, and thus brightness, profile, it is still the inner disk that needs to be obscured. This result strongly supports that the obscuring cloud must be part of the inner disk/envelope within a few tenths of an AU, and dusty structures in the outer disk passing through the line of sight can be excluded. We can make a simple estimate for the mass of the obscuring cloud by considering that it causes at most AV ~ 20 mag extinction (Fig. 3). Taking the relation between optical extinction and hydrogen column density from Güver & Özel (2009), AV ~ 20 mag corresponds to a column density of 0.07 g cm-2 of gas and dust. Assuming a simple slab geometry with a radius of 0.1 AU, the total cloud mass is in the order of 10-10 M⊙. Comparing this value with the total estimated circumstellar mass of 0.06 M⊙ (Hillenbrand et al. 2013), this can be considered as a small mass inhomogeneity.
It is noteworthy that the optical variability amplitude of V2492 Cyg is significantly higher than typical minima depths of UXors. UXors usually show only 1 − 3 mag fadings and exhibit a characteristic blueing in the faintest state due to the increasing contribution of scattered light from the circumstellar matter to the total brightness of the system. This scattered-light component also naturally limits the observed amplitudes of the brightness variations of UXors (Grinin 1988; Natta & Whitney 2000). That V2492 Cyg exhibits much deeper minima may be related to the fact that the obscuring cloud in this system is probably larger. It covers not only the central star but also the inner part of the circumstellar matter, thus eclipsing any scattered light from the system. In this respect, V2492 Cyg can be regarded as a young and embedded analog of UXors.
We speculate about two possible scenarios concerning the origin of the obscuring structure. One is a pre-existing, long-lived orbiting dust structure that moves in/out of the line of sight. The other is a transient appearance/disappearance of dust clouds in the system, due either to dust condensation/evaporation driven by the changing accretion heating or released from an accretion disk surface by turbulence (Turner et al. 2010). Due to its large opacity, the cloud casts a shadow onto the outer parts of the circumstellar matter, decreasing the far-infrared thermal emission of the shadowed area. In the case of the permanent orbiting cloud, this shadow would not change the total integrated far-infrared flux. However, in the transient case, depending on the solid angle as seen from the star, detectable far-infrared flux changes may occur (as was seen in the case of PV Cep, see Fig. 3 of Kun et al. 2011). Since part of the far-infrared radiation comes from an optically thin medium (envelope, disk surface), the flux changes should be synchronous with the optical/near-infrared flux changes. In our 70 μm Herschel monitoring (Sect. 3.2), we observed no detectable flux changes at 70 μm or 160 μm. Although this result does not completely exclude the transient scenario (if the solid angle of the cloud is small enough or the relative contribution of optically thin emission to the total far-infrared flux is low), it favors the long-lived dust structure. A consequence of the latter scenario is some periodicity in the light variations, possibly corresponding to the deep minima in Fig. 1. The small-scale variability seen in our light curves might correspond to smaller inhomogeneities within the obscuring cloud.
Although changing extinction is very likely the dominant factor in the light variations of V2492 Cyg, our observations indicate that there are additional effects, too. Figure 2 shows that while the VRI and 3.6 − 4.5 μm magnitude changes are consistent with the reddening, the JHKS amplitudes are higher. In order to explain this, we may consider a scenario where there is scattered light from the directly illuminated side of the obscuring dust cloud. When the cloud passes out of the line of sight and moves behind the central source, the source becomes unobscured on one hand and on the other, an additional scattered light component appears. Another effect, expected to be most important at the same orbital phase, may be extra near-infrared thermal radiation from the orbiting dust cloud. These effects act in the same direction and could qualitatively explain the larger JHKS variability amplitudes seen in Fig. 2.
We can check whether the observed spectral changes are consistent with the picture described above. The most conspicuous change in the near-infrared spectra was the disappearence of the H I lines during the faint phase of the system in 2011 July−August, while the H2 lines did not disappear, but became slightly stronger. Considering that the atomic hydrogen lines originate from a hotter, denser environment probably closer to the central star than where the molecular hydrogen lines are emitted, it is possible that the H I lines were simply obscured, probably extincted by the same cloud that affected the continuum and broad-band photometry. Alternatively, the lack of the Br γ line could be interpreted as the cease of accretion; however, the SED clearly shows that an outburst component, i.e., the release of accretion energy, was still present in the faint state. This apparent contradiction can be resolved if the H I lines are related to the stellar wind rather than to the accretion, and their disappearance signals the weakening of the wind. Indeed, Covey et al. (2011) and Aspin (2011) saw signatures of mass loss in their spectra.
Finally, an interesting question is whether the existence of the orbiting dust cloud is related to the outburst or whether eclipses could occur during the quiescent phases as well. Our results, mainly based on the Herschel monitoring, suggest that the obscuring cloud is not a short-lived temporary structure. Checking the historical brightness values of V2492 Cyg, Hillenbrand et al. (2013) concluded that in the past the source also exhibited light variations in quiescence. Thus, the dust cloud might be present in the inner part of the system for a longer time. The origin of such an asymmetric structure also needs explanation because in an equilibrium disk, density inhomogeneities would be quickly ironed out. In a similar situation, Muzerolle et al. (2009) argued that the orbiting warp observed around the low-mass star LRLL 31 might be maintained by a closeby companion/planet. The structure of the obscuring dust cloud in the V2492 Cyg system, nevertheless, might have been changing during the outburst, because the increased stellar wind and stellar radiation could remove/evaporate dust particles that might move back/recondensate in the lower intensity periods. This effect may explain why the eclipses are not strictly periodic and why both the time width and the amplitude of the fadings are variable.
5. Summary and conclusions
Using ground-based instrumentation as well as the Spitzer and Herschel space telescopes, we obtained new multi-epoch observations between 0.55 μm and 160 μm of the young eruptive star V2492 Cyg. We describe the flux evolution in the optical − infrared domain between the peak brightness in 2010 August and 2012 December, and we analyze the circumstellar and interstellar environment of the star. Our main results and conclusions are the following:
-
V2492 Cyg is a young stellarobject located at the tip of a small dark cloud, which was mappedby our Herschel observations. The densest parts of the cloud havean extinction of up to 30 mag and a temperatureof 15 K. This cloud contains another youngstellar object, the newly discoveredHH 570 IRS.
-
The light curves of V2492 Cyg show large amplitude variability including two very deep minima. Our analysis revealed that a single physical mechanism is responsible for the brightness changes, and the color variations suggest with high accuracy that the most likely explanation is changing extinction along the line of sight. In this respect, V2492 Cyg can be regarded as a young, embedded analog of UX Orionis-type variables.
-
We propose that the obscuring structure is a non-axisymmetric dust cloud orbiting in the inner disk. Its optical thickness is in the 13−20 mag range. Our order-of-magnitude estimates suggest that its mass is about 10-10 M⊙, and it is orbiting at a few tenths of an AU from the star. The eclipses indicate that the geometry of the system is closer to edge-on than to pole-on. The disappearance of the H I lines during the faintest state also supports the obscuration scenario.
-
We found that the source exhibits higher amplitude variations in the near-infrared than expected from the optical amplitudes assuming a standard extinction curve. We speculate that scattered light as well as hot dust emission from the directly illuminated side of the orbiting cloud is responsible for this.
-
In order to decide whether the orbiting dust cloud is a temporary feature or a long-lived structure, we monitored the far-infrared flux with Herschel. The results are more consistent with a relatively long-lived feature.
-
The brightening of the source before 2010 August could not be explained by extinction changes. Our data show a flux increase in the whole 0.55 − 70 μm wavelength range and suggest that the outburst component is not a single temperature blackbody. This component seems to be mostly invariant since the epoch of the peak brightness, suggesting a long-term (>2 yr) eruption.
Online material
Optical and near-infrared photometry in magnitudes for V2492 Cyg.
Mid-infrared and far-infrared photometry in Jy for V2492 Cyg.
Acknowledgments
We thank the referee, Dr. V. Grinin, for his valuable comments, in particular those emphasizing the physical similarity between V2492 Cyg and the UX Orionis-type stars. We acknowledge with thanks the variable star observations from the AAVSO International Database contributed by observers worldwide and used in this research, including recent monitoring by James Roe obtained through the Lowell Amateur Research Initiative. This work was partly supported by the grants OTKA-101393, OTKA-104607, OTKA K-81373, and OTKA K-81966 of the Hungarian Scientific Research Fund, by the Lendület-2009 Young Researchers’ Program of the Hungarian Academy of Sciences, by the HUMAN MB08C 81013 grant of the MAG Zrt, by the János Bolyai Research Scholarship of the Hungarian Academy of Sciences, and by the grant LP2012-31/2012. The William Herschel Telescope and its service program are operated on the island of La Palma by the Isaac Newton Group in the Spanish Observatorio del Roque de los Muchachos of the Instituto de Astrofísica de Canarias. This work is based in part on observations made with the Telescopio
Carlos Sánchez operated on the island of Tenerife by the Instituto de Astrofísica de Canarias in the Observatorio del Teide. The authors wish to thank the telescope manager A. Oscoz, the support astronomers and telescope operators for their help during the observations, as well as the service mode observers. PACS has been developed by a consortium of institutes led by MPE (Germany) and including UVIE (Austria); KUL, CSL, IMEC (Belgium); CEA, OAMP (France); MPIA (Germany); IFSI, OAP/AOT, OAA/CAISMI, LENS, SISSA (Italy); IAC (Spain). This development has been supported by the funding agencies BMVIT (Austria), ESA-PRODEX (Belgium), CEA/CNES (France), DLR (Germany), ASI (Italy), and CICT/MCT (Spain). SPIRE has been developed by a consortium of institutes led by Cardiff Univ. (UK) and including Univ. Lethbridge (Canada); NAOC (China); CEA, LAM (France); IFSI, Univ. Padua (Italy); IAC (Spain); Stockholm Observatory (Sweden); Imperial College London, RAL, UCL-MSSL, UKATC, Univ. Sussex (UK); and Caltech, JPL, NHSC, Univ. Colorado (USA). This development has been supported by national funding agencies: CSA (Canada); NAOC (China); CEA, CNES, CNRS (France); ASI (Italy); MCINN (Spain); SNSB (Sweden); STFC (UK); and NASA (USA).
References
- Acosta-Pulido, J. A., Kun, M., Ábrahám, P., et al. 2007, AJ, 133, 2020 [NASA ADS] [CrossRef] [Google Scholar]
- Aspin, C. 2011, AJ, 141, 196 [NASA ADS] [CrossRef] [Google Scholar]
- Bally, J., & Reipurth, B. 2003, AJ, 126, 893 [NASA ADS] [CrossRef] [Google Scholar]
- Cardelli, J. A., Clayton, G. C., & Mathis, J. S. 1989, ApJ, 345, 245 [NASA ADS] [CrossRef] [Google Scholar]
- Covey, K. R., Hillenbrand, L. A., Miller, A. A., et al. 2011, AJ, 141, 40 [NASA ADS] [CrossRef] [Google Scholar]
- Cutri, R. M., Wright, E. L., Conrow, T., et al. 2012, Explanatory Supplement to the WISE All-Sky Data Release Products, Tech. rep. [Google Scholar]
- Draine, B. T. 2006, ApJ, 636, 1114 [NASA ADS] [CrossRef] [Google Scholar]
- Eaton, N. L., & Herbst, W. 1994, in BAAS 26, Meeting Abstracts #184, 933 [Google Scholar]
- Gordon, K. D., Engelbracht, C. W., Rieke, G. H., et al. 2008, ApJ, 682, 336 [NASA ADS] [CrossRef] [Google Scholar]
- Griffin, M. J., Abergel, A., Abreu, A., et al. 2010, A&A, 518, L3 [Google Scholar]
- Grinin, V. P. 1988, Sov. Astron. Lett., 14, 27 [NASA ADS] [Google Scholar]
- Grinin, V. P., Kiselev, N. N., Chernova, G. P., Minikulov, N. K., & Voshchinnikov, N. V. 1991, Ap&SS, 186, 283 [NASA ADS] [CrossRef] [Google Scholar]
- Güver, T., & Özel, F. 2009, MNRAS, 400, 2050 [NASA ADS] [CrossRef] [Google Scholar]
- Hartmann, L., & Kenyon, S. J. 1996, ARA&A, 34, 207 [NASA ADS] [CrossRef] [EDP Sciences] [MathSciNet] [Google Scholar]
- Hillenbrand, L. A., Miller, A. A., Covey, K. R., et al. 2013, AJ, 145, 59 [NASA ADS] [CrossRef] [Google Scholar]
- Itagaki, K., & Yamaoka, H. 2010, Central Bureau Electronic Telegrams, 2426, 1 [NASA ADS] [Google Scholar]
- Juhász, A., Dullemond, C. P., van Boekel, R., et al. 2012, ApJ, 744, 118 [NASA ADS] [CrossRef] [Google Scholar]
- Kiss, C., Ábrahám, P., Laureijs, R. J., Moór, A., & Birkmann, S. M. 2006, MNRAS, 373, 1213 [NASA ADS] [CrossRef] [Google Scholar]
- Koornneef, J. 1983, A&A, 128, 84 [NASA ADS] [Google Scholar]
- Kóspál, Á., Ábrahám, P., Prusti, T., et al. 2007, A&A, 470, 211 [NASA ADS] [CrossRef] [EDP Sciences] [Google Scholar]
- Kóspál, Á., Ábrahám, P., Acosta-Pulido, J. A., et al. 2011, A&A, 527, A133 [NASA ADS] [CrossRef] [EDP Sciences] [Google Scholar]
- Kun, M., Szegedi-Elek, E., Moór, A., et al. 2011, MNRAS, 413, 2689 [NASA ADS] [CrossRef] [Google Scholar]
- Meyer, M. R., Calvet, N., & Hillenbrand, L. A. 1997, AJ, 114, 288 [NASA ADS] [CrossRef] [Google Scholar]
- Mosoni, L., Sipos, N., Ábrahám, P., et al. 2013, A&A, in press, DOI: 10.1051/0004-6361/201218770 [Google Scholar]
- Müller, T., Nielbock, M., Balog, Z., Klaas, U., & Vilenius, E. 2011, Tech. rep. PICC-ME-TN-037 [Google Scholar]
- Munari, U., Valisa, P., Dallaporta, S., & Itagaki, K. 2010, Central Bureau Electronic Telegrams, 2428, 1 [NASA ADS] [Google Scholar]
- Muzerolle, J., Megeath, S. T., Flaherty, K. M., et al. 2005, ApJ, 620, L107 [CrossRef] [Google Scholar]
- Muzerolle, J., Flaherty, K., Balog, Z., et al. 2009, ApJ, 704, L15 [NASA ADS] [CrossRef] [Google Scholar]
- Natta, A., & Whitney, B. A. 2000, A&A, 364, 633 [NASA ADS] [Google Scholar]
- Ott, S. 2010, in Astronomical Data Analysis Software and Systems XIX, eds. Y. Mizumoto, K.-I. Morita, & M. Ohishi, ASP Conf. Ser., 434, 139 [Google Scholar]
- Poglitsch, A., Waelkens, C., Geis, N., et al. 2010, A&A, 518, L2 [NASA ADS] [CrossRef] [EDP Sciences] [Google Scholar]
- Reipurth, B., & Aspin, C. 2004, ApJ, 606, L119 [NASA ADS] [CrossRef] [Google Scholar]
- Roussel, H. 2012 [arXiv:1205.2576] [Google Scholar]
- Smith, M. D. 1995, A&A, 296, 789 [NASA ADS] [Google Scholar]
- Stahler, S. W., & Palla, F. 2005, The Formation of Stars [Google Scholar]
- Straizys, V., Meistas, E., Vansevicius, V., & Goldberg, E. P. 1989, A&A, 222, 82 [NASA ADS] [Google Scholar]
- Turner, N. J., Carballido, A., & Sano, T. 2010, ApJ, 708, 188 [NASA ADS] [CrossRef] [Google Scholar]
- van Boekel, R., Juhász, A., Henning, T., et al. 2010, A&A, 517, A16 [NASA ADS] [CrossRef] [EDP Sciences] [Google Scholar]
- Wright, E. L., Eisenhardt, P. R. M., Mainzer, A. K., et al. 2010, AJ, 140, 1868 [NASA ADS] [CrossRef] [Google Scholar]
- Zhu, Z., Hartmann, L., Gammie, C., & McKinney, J. C. 2009, ApJ, 701, 620 [NASA ADS] [CrossRef] [Google Scholar]
All Tables
All Figures
|
Fig. 1 Light curves of V2492 Cyg. Filled dots are from Paper I and this work, asterisks are from Covey et al. (2011), Aspin (2011), and from the AAVSO database (http://www.aavso.org). For clarity, the V, I, J, H, KS, [3.6], and [4.5] light curves are shifted along the y axis. Downward arrows indicate 3σ upper limits (this work). Tick marks on the top indicate the first day of each month. Vertical dashed line marks the epoch when our WHT/LIRIS spectum was taken. |
| In the text | |
|
Fig. 2 Magnitude changes of V2492 Cyg relative to the V-band. Interstellar reddening for RV = 3.1 is overplotted with dotted line and for RV = 5.0 with dashed line (Cardelli et al. 1989). The small insets show examples for scatter plots from which the relative magnitude changes were determined as the slope of the fitted lines. |
| In the text | |
|
Fig. 3 Color − color and color–magnitude diagrams of V2492 Cyg. The open circle represents quiescent (2006) data from Paper I, while filled dots mark observations taken in 2010 − 2012 from Paper I and from this work. The main sequence is marked by a thick solid line, the giant branch with a dotted line (Koornneef 1983), the reddening path for RV = 3.1 with dashed lines (Cardelli et al. 1989), and the T Tauri locus with a dash-dotted line (Meyer et al. 1997). |
| In the text | |
|
Fig. 4 Multi-epoch SEDs of V2492 Cyg. Open circles represent quiescent data from Paper I and references therein, except for the 1100 μm point, which is from Aspin (2011). Although these points are not contemporaneous, we connected them with a dotted line to guide the eye. Filled symbols show outburst observations at four different epochs. Data from 2010 May are from the WISE catalog, data from 2010 September are from Covey et al. (2011) and Aspin (2011), and data from 2011 − 2012 are from this work. |
| In the text | |
|
Fig. 5 Flux-calibrated ZJ and HK spectra of V2492 Cyg taken on 2011 August 1 with LIRIS on the WHT. |
| In the text | |
|
Fig. 6 Pixel values as a function of distance from the source centroid for the background-subtracted PACS images taken on 2011 November 29 and for the SPIRE images taken on 2012 January 3 (black dots). Red dots were obtained in a similar way, but using observations of α Boo for PACS and the official beam profiles for SPIRE. |
| In the text | |
|
Fig. 7 False-color composites depicting the environment of V2492 Cyg. Each image shows the same 3′ × 3′ area. The two leftmost images are linearly scaled, the two rightmost ones are logarithmically scaled. The V, R, I composite was constructed by shifting and co-adding several exposures taken with the Schmidt telescope at Konkoly Observatory, obtained between 2011 November 1 − 30. The J, H, KS composite was obtained with the WHT on 2011 July 22. The 70, 100, 160 μm composite uses all Herschel/PACS images taken between 2011 October 29 and 2012 January 11. The 250, 350, 500 μm composite is made of Herschel/SPIRE images taken on 2012 January 3. Gray × symbols mark the position of V2492 Cyg (α2000 = 20h51m26 |
| In the text | |
Current usage metrics show cumulative count of Article Views (full-text article views including HTML views, PDF and ePub downloads, according to the available data) and Abstracts Views on Vision4Press platform.
Data correspond to usage on the plateform after 2015. The current usage metrics is available 48-96 hours after online publication and is updated daily on week days.
Initial download of the metrics may take a while.