Free Access
Fig. 6
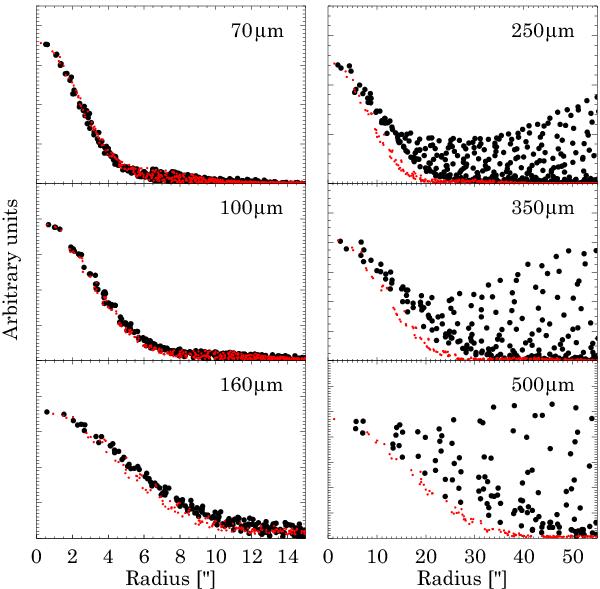
Pixel values as a function of distance from the source centroid for the background-subtracted PACS images taken on 2011 November 29 and for the SPIRE images taken on 2012 January 3 (black dots). Red dots were obtained in a similar way, but using observations of α Boo for PACS and the official beam profiles for SPIRE.
Current usage metrics show cumulative count of Article Views (full-text article views including HTML views, PDF and ePub downloads, according to the available data) and Abstracts Views on Vision4Press platform.
Data correspond to usage on the plateform after 2015. The current usage metrics is available 48-96 hours after online publication and is updated daily on week days.
Initial download of the metrics may take a while.