Fig. 3
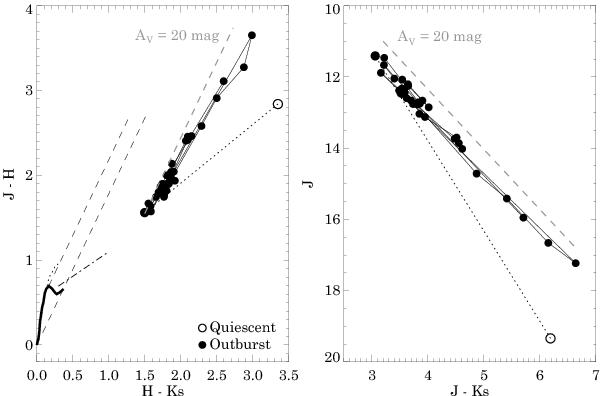
Color − color and color–magnitude diagrams of V2492 Cyg. The open circle represents quiescent (2006) data from Paper I, while filled dots mark observations taken in 2010 − 2012 from Paper I and from this work. The main sequence is marked by a thick solid line, the giant branch with a dotted line (Koornneef 1983), the reddening path for RV = 3.1 with dashed lines (Cardelli et al. 1989), and the T Tauri locus with a dash-dotted line (Meyer et al. 1997).
Current usage metrics show cumulative count of Article Views (full-text article views including HTML views, PDF and ePub downloads, according to the available data) and Abstracts Views on Vision4Press platform.
Data correspond to usage on the plateform after 2015. The current usage metrics is available 48-96 hours after online publication and is updated daily on week days.
Initial download of the metrics may take a while.