Fig. 1
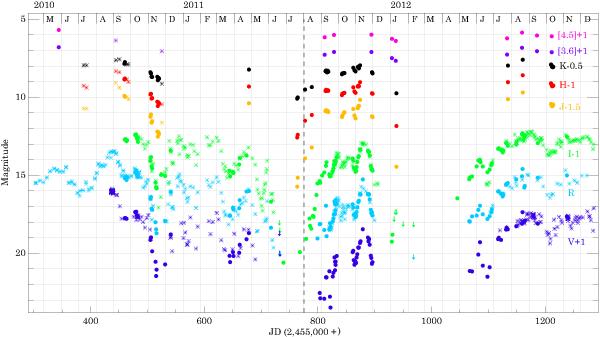
Light curves of V2492 Cyg. Filled dots are from Paper I and this work, asterisks are from Covey et al. (2011), Aspin (2011), and from the AAVSO database (http://www.aavso.org). For clarity, the V, I, J, H, KS, [3.6], and [4.5] light curves are shifted along the y axis. Downward arrows indicate 3σ upper limits (this work). Tick marks on the top indicate the first day of each month. Vertical dashed line marks the epoch when our WHT/LIRIS spectum was taken.
Current usage metrics show cumulative count of Article Views (full-text article views including HTML views, PDF and ePub downloads, according to the available data) and Abstracts Views on Vision4Press platform.
Data correspond to usage on the plateform after 2015. The current usage metrics is available 48-96 hours after online publication and is updated daily on week days.
Initial download of the metrics may take a while.