| Issue |
A&A
Volume 551, March 2013
|
|
|---|---|---|
| Article Number | A104 | |
| Number of page(s) | 7 | |
| Section | Extragalactic astronomy | |
| DOI | https://doi.org/10.1051/0004-6361/201118755 | |
| Published online | 01 March 2013 | |
Flux and color variations of the doubly imaged quasar UM673⋆,⋆⋆
1 Département d’Astrophysique, Géophysique et Océanographie, Bât. B5C, Sart Tilman, Université de Liège, 4000 Liège 1, Belgium
e-mail: This email address is being protected from spambots. You need JavaScript enabled to view it.
2 Main Astronomical Observatory, Academy of Sciences of Ukraine, Zabolotnoho 27, 03680 Kyiv, Ukraine
3 Centro de Astro-Ingeniería, Departamento de Astronomía y Astrofísica, Pontificia Universidad Católica de Chile, Casilla 306, Santiago, Chile
4 Max-Planck-Institut für Astronomie, Königstuhl 17, 69117 Heidelberg, Germany
5 Dipartimento di Fisica “E.R. Caianiello”, Università degli Studi di Salerno, via Ponte Don Melillo, 84085 Fisciano (SA), Italy
6 Instituto Nazionale di Fisica Nucleare, Sezione di Napoli, Italy
7 SUPA, University of St Andrews, School of Physics & Astronomy, North Haugh, St Andrews, KY16 9SS, UK
8 Deutsches SOFIA Institut, Universitaet Stuttgart, Pfaffenwaldring 31, 70569 Stuttgart, Germany
9 Istituto Internazionale per gli Alti Studi Scientifici (IIASS), Vietri Sul Mare (SA), Italy
10 Institut für Astrophysik, Georg-August-Universität Göttingen, Friedrich-Hund-Platz 1, 37077 Göttingen, Germany
11 Department of Physics & Astronomy, Aarhus University, Ny Munkegade, 8000 Aarhus C, Denmark
12 Niels Bohr Institute, University of Copenhagen, Juliane Maries vej 30, 2100 Copenhagen Ø, Denmark
13 KASI – Korea Astronomy and Space Science Institute, 776 Daedukdae-ro, Yuseong-gu, Daejeon 305-348, Republic of Korea
14 National Space Institute, Technical University of Denmark, 2800 Lyngby, Denmark
15 Astronomisches Rechen-Institut, Zentrum für Astronomie, Universität Heidelberg, Mönchhofstraße 12–14, 69120 Heidelberg, Germany
16 Dipartimento di Ingegneria, Università del Sannio, Corso Garibaldi 107, 82100 Benevento, Italy
17 Bellatrix Astronomical Observatory, Center for Backyard Astrophysics, Ceccano (FR), Italy
18 Physics Department, Sharif University of Technology, Tehran, Iran
19 European Southern Observatory, Casilla 19001, Santiago 19, Chile
20 Max Planck Institute for Solar System Research, Max-Planck-Str. 2, 37191 Katlenburg-Lindau, Germany
21 Astrophysics Group, Keele University, Newcastle-under Lyme, ST5 5BG, UK
22 Dark Cosmology Centre, Niels Bohr Institute, University of Copenhagen, Juliane Maries Vej 30, 2100 Copenhagen, Denmark
23 INAF, Osservatorio Astronomico di Brera, 23807 Merate, Italy
24 SOFIA Science Center, NASA Ames Research Center, Mail Stop N211-3, Moffett Field CA 94035, USA
25 Centre for Starand Planet Formation, Geological Museum, Øster Voldgade 5, 1350 Copenhagen, Denmark .
26 Jodrell Bank Centre for Astrophyics, University of Manchester, UK
27 Alsubai’s Establishment for Scientific Studies, Qatar
28 Space Telescope Science Institute (STScI), USA
29 Perimeter Institute for Theoretical Physics, 31 Caroline Street North, Waterloo, Ontario N2L 2Y5, Canada
30 INAF/Istituto di Astrofisica Spaziale e Fisica Cosmica, Bologna, via Gobetti 101, 40129 Bologna, Italy
31 Instituto de Astronomía, Universidad Nacional Autónoma de México, Apdo. Postal 877, Ensenada, B.C. 22800, Mexico
32 Departamento de Ciencias Físicas, Universidad Andrés Bello, Av. República 252, Santiago, Chile
Received: 28 December 2011
Accepted: 31 January 2013
Abstract
Aims. With the aim of characterizing the flux and color variations of the multiple components of the gravitationally lensed quasar UM673 as a function of time, we have performed multiepoch and multiband photometric observations with the Danish telescope at the La Silla Observatory.
Methods. The observations were carried out in the VRi spectral bands during four seasons (2008–2011). We reduced the data using the point spread function photometric technique as well as aperture photometry.
Results. Our results show for the brightest lensed component some significant decrease in flux between the first two seasons (+ 0.09/+ 0.11/+ 0.05 mag) and a subsequent increase during the following ones (− 0.11/− 0.11/− 0.10 mag) in the V/R/i spectral bands, respectively. Comparing our results with previous studies, we find smaller color variations between these seasons as compared with previous ones. We also separate the contribution of the lensing galaxy from that of the fainter and close lensed component.
Key words: gravitational lensing: strong / quasars: general / techniques: photometric / quasars: individual: UM673
Based on data collected by MiNDSTEp with the Danish 1.54 m telescope at the ESO La Silla Observatory
Light curves are only available in electronic from at the CDS via anonymous ftp to cdsarc.u-strasbg.fr (130.79.128.5) or via http://cdsarc.u-strasbg.fr/viz-bin/qcat?J/A+A/551/A104
Royal Society University Research Fellow.
Also Directeur de Recherche honoraire du FRS-FNRS.
© ESO, 2013
1. Introduction
Multiply imaged quasars are of great interest in astrophysics due to the possibility, from observed flux and color variations between the lensed components, to distinguish between intrinsic quasar variations caused by the accretion mechanism, and microlensing effects induced by stars in the lens galaxy (Wambsganss 2006).
In previous papers (Ricci et al. 2011b,a), we have studied such variations for the quadruply imaged quasar HE 0435-1223, observed in the framework of a VRi multiepoch monitoring of five lensed quasars1, a parallel project of the Microlensing Network for the Detection of Small Terrestrial Exoplanets (MiNDSTEp) campaign (Dominik et al. 2010).
In the current paper, we focus on UM673/Q0142–100 (see Fig. 1), a doubly imaged quasar discovered by Surdej et al. (1987) during a high resolution imaging survey of HLQs (Highly Luminous Quasars) and subsequently studied by our team (Smette et al. 1990, 1992; Daulie et al. 1993; Nakos et al. 2005).
Surdej et al. (1988) reported a separation of 2.22″ between the components “A” (brighter) and “B” (fainter), and found their V magnitudes to be 16.9 and 19.1 respectively, at a redshift z = 2.719. The redshift of the sensibly fainter (R = 19.2) lensing galaxy, located very close to the “B” component, was derived to be z = 0.49, and the time delay between the two lensed components was estimated around 7 weeks.
A photometric monitoring of UM673 was performed during the years 1987–1993 (Daulie et al. 1993), but the photometry did not show any clear evidence for relative variations over the considered period.
In the framework of the CfA Arizona Space Telescope LEns Survey (castles) project, precise astrometry of the components and of the lens galaxy “G” was obtained2. The colors of the lens galaxy were found to match those of a passively evolving early-type galaxy at z ≈ 0.5 (Muñoz et al. 1998).
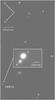 |
Fig. 1 DFOSC V filter image, taken on 2008-08-03, showing the position of UM673 and the stars “R”, “S”, “T”, “U”, and “V” used to search for a suitable reference star. The “V” star was finally chosen. “G1” and “G2” are field galaxies. The inset zoom shows the two components “A” and “B” of the lensed quasar. |
Lehár et al. (2000, 2002) reported Hubble Space Telescope (HST) observations of UM673 at optical and infrared wavelengths, and Sinachopoulos et al. (2001) observed the lensed quasar in the R filter for six seasons (1995–2000), detecting a significant increase by 0.3 mag of the combined system (lensed components) with respect to the values reported at discovery, with a peak of 0.5 mag during the period 1995–1997. Lehár et al. (2000) performed photometric measurements on HST data taken in the R filter, and obtained magnitudes of 16.67, 18.96, and 19.35 for the “A”, “B” components and the lens galaxy, respectively.
After spectrophotometric observations performed in 2002 by Wisotzki et al. (2004), which did not show any evidence of microlensing, the first multifilter monitoring of UM673 was carried out by Nakos et al. (2005) between 1998 and 1999, in the Cousins V and Gunn i filters. Analysis of the light curves was made using three different photometric methods: image deconvolution (Magain et al. 2007), point spread function (PSF) fitting, and image subtraction. Nakos et al. (2005) found that component “A” displayed possible evidence for microlensing.
Koptelova et al. (2008, 2010a,b) and Koptelova & Oknyanskij (2010) observed the object in the VRI bands and succeeded for the first time in determining a time delay:  days (at 68% and 95% confidence levels).
Furthermore, Fadely & Keeton (2011) examined the wavelength dependence of the flux ratios for several gravitationally lensed quasars using K and L′-band images obtained with the Gemini North telescope, detecting no difference between the two flux ratios for the specific case of UM673 (“B”/“A” = 0.128 ± 0.002 in the K-band and 0.132 ± 0.006 in the L′-band).
Finally, in a recent paper, Koptelova et al. (2012) re-estimated the determination of the time delay to a value of 89 ± 11 days using 2001–2011 VRI observations, and suggested the brightness variations to be mainly due to intrinsic variations of the quasar.
We present multiepoch photometric monitoring data of UM673 over four seasons (2008–2011), carried out in three filters (VRi) with the Danish Faint Object Spectrograph and Camera (DFOSC) instrument of the Danish telescope at the La Silla Observatory.
The observations and the pre-processing of the images are presented in Sect. 2. Section 3 presents the reduction techniques and the results are shown in Sect. 4. Finally, Sect. 5 contains the main conclusions.
2. Observations and pre-processing
We monitored UM673 during four seasons (2008–2011) using the Danish telescope at the La Silla Observatory, equipped with the DFOSC instrument, providing 2147 × 2101 pixel CCD frames over a field of view of 13.7′ × 13.7′ with a declared resolution of 0.39″/pixel. The RON (read-out-noise) of the CCD camera in high-mode (gain g = 0.74 electron/ADU) is 3.1 electrons per pixel. With the exception of the re-aluminization of the primary mirror in 2009, the configuration software/hardware of the telescope did not change over the four seasons of observation. The data were collected in the Bessel V, Bessel R, and Gunn i filters3.
We obtained a total number of 488 VRi images corresponding to 160 nights over the four seasons. The details are given in Table 1.
In 2010, no i filter image was taken, as the monitoring was foreseen since the beginning in the only VR filters, and the i filter images were taken depending on the remaining telescope time with respect to the other MiNDSTEp parallel projects. All the frames were acquired with a exposure.
We treated the images following the same procedure as those relative to HE 0435-1223 described in a previous paper (Ricci et al. 2011b), with the exception that we used the images already de-biased and flat-fielded in loco by the Interactive Data Language (IDL) automatic pipeline used at the Danish Telescope for the daily monitoring of the bulge microlenses.
3. Data reduction
We carefully checked the history of the scale of the images between the various seasons, and we found a constant value of 0.395″/pixel. We froze this angular scale in the data reduction. We also checked the evolution of the position angle between the CCD pixel grid and the equatorial coordinate system, finding a change in angle between the seasons: 4.5′ between 2008 and 2009, 5.2′ between 2008 and 2010, and 4.7′ between 2008 and 2011. We took this effect into account in our data reduction.
Finally, we checked the seeing values for all the observations. We decided to fit the “U” star (see Fig. 1) with a two-dimensional Gaussian function, and we found that the R filter images had the best seeing. We then decided to search for a suitable reference star in that filter.
We disregarded all those images for which the two lensed components were unresolved (seeing >2″). Independently we measured the flux ratio between the two bright galaxies “G1” and “G2” (see Fig. 1) using aperture photometry (we integrated a square area of 40 × 40 pixels centered on each galaxy). In the analysis we only used those images for which this flux ratio was stable, corresponding to a total of 9–18 images per season, depending on the filter.
The reference candidates are the stars “R”, “S”, “T”, “U” and “V” in Fig. 1: we compared the fluxes of these stars with the total flux of the bright galaxies “G1” and “G2” using aperture photometry. For this test we decided to use galaxies because we can be sure of their stability. Table 2 contains the maximum differences of the magnitudes between seasons and in sigma units for the five concerned stars.
On the basis of this analysis, we conclude that star “R” and star “V” are comparably stable. However, star “V” is closer to the lens system, and it is therefore better to use its shape as a reference PSF for the lens fitting. Also, it had been found to be photometrically stable by Sinachopoulos et al. (2001) and Nakos et al. (2003); finally it was already used by Nakos et al. (2005) as a reference for the PSF fitting of UM673.
From all these considerations, we decided to use star “V” as the reference star for the PSF fitting of the lens system. To calibrate the magnitudes in the VRi filters, we used the values of the star “V” provided by Nakos et al. (2003): mV = 16.54 ± 0.01, mR = 16.00 ± 0.01, and mI = 15.55 ± 0.01. Moreover, we calculated the R magnitude of the “G1” and “G2” galaxies with aperture photometry, using “V” as the reference star. We found values of mR = 17.47 ± 0.03 for “G1”, and mR = 17.92 ± 0.05 for “G2”.
We tested if it was possible, on the basis of our data, to measure independently the magnitude of the lens galaxy “G” in each band. We found that the R band images had better quality, and we proceeded using these images. Each image was interpolated with a bicubic spline and every pixel was divided in a grid of 20 × 20 new sub-pixels. Then we superposed these oversampled images and we summed them up to obtain an oversampled image with a high signal-to-noise ratio (see Fig. 2). We used the “V” reference star as reference PSF. We fitted the gravitational lens system with two PSFs for the “A” and “B” lensed components, fixing their relative astrometry. We then adjusted the scale factors of those two PSFs to retrieve the uncontaminated image of the background lens galaxy. We used aperture photometry to derive its magnitude relatively to the “V” reference star.
To improve the accuracy of the photometry, we added two factors to scale the fluxes of the “A” and “B” lensed components. We varied the factor of the “A” component from 0.94 to 1.1 with a step of 0.0022, and we varied the factor of the “B” component from 0.2 to 1.1 with a step of 0.04.
First we constructed an array of residual maps for these two factor combinations, and for each residual map we calculated the coordinates of the light center of the galaxy “G”. As a criterion for the correctness of the obtained galaxy image we chose the distance from its light center to the expected one, provided by the accurate astrometry measurements. The distance between the “B” lensed component and the galaxy “G” provided by HST data is 0.38″, which is ≈20 new sub-pixels. So we assumed that the distance between the obtained and expected light center of “G” should be less than half the distance between the galaxy “G” and the “B” lensed component (<10 new sub-pixels).
We applied the same criterion between the expected and observed position of the maximum of light of the galaxy “G”. Indeed, the light center of “G” may be slightly offest from its maximum of light.
We considered that the overlap between the regions where these two conditions are satisfied fixes the region of allowed values for the two scale factors, and the minimum and maximum magnitudes of galaxy “G” which are 19.02 and 19.56, respectively. From that, we then independently calculated the magnitude of the lensing galaxy “G” in the R band as 19.29 ± 0.27. If we calculate this value as an average magnitude over all the allowed values for the two scale factors, we obtain 19.27 ± 0.15. Both these values, within the error bars, are in good agreement with the HST data. An image of the reconstructed galaxy is shown in Fig. 3.
Therefore, in the following analysis we considered the magnitudes of the lens galaxy “G” as being those previously measured with HST. HST results (named GHST), obtained using HST filters, were converted to the ground-based photometric system by Lehár et al. (2000) using Holtzman et al. (1995) calibrations. The V, R and i magnitudes that they derived for the galaxy are: GV = 20.81 ± 0.02, GR = 19.35 ± 0.01, and GI = 18.72 ± 0.03.
We applied the PSF fitting technique while accounting for the magnitude of the lens on the best frames previously chosen, by refining the robust method already used in our previous work (Ricci et al. 2011b).
Our method is based on the simultaneous fit of each frame with two PSFs for the “A” and “B” components, and the de Vaucouleurs profile for the lens galaxy “G”, fixing the relative astrometry between the components in accordance with measurements from Muñoz et al. (1998). We also fixed the magnitudes of the galaxy “G” to the above mentioned values. For a more accurate fitting, we used a bicubic interpolation of the images.
Koptelova et al. (2010b, 2012) observed UM673 with the VRI filters, and derived the photometry without separately taking into account the magnitude of “B” and that of the lens galaxy “G”. As the lens galaxy is located very close to the “B” component, and for comparison with other works, we also calculated the magnitudes of the “B”+“G” components as a simple superposition of their fluxes. Let us label “B+G” the results obtained in this way.
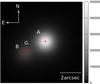 |
Fig. 2 Composite image of UM673 obtained by superposing the 44 best quality CCD images in the R filter, resampled by dividing each pixel in a grid of 20 × 20 subpixels and recentering the images with an accuracy of one new subpixel. The positions of the components, provided by HST, are also shown. |
4. Results
4.1. Flux variations
The separate light curves of the two lensed components “A” and “B” of UM673 and the “B+G” light curve are shown in Fig. 4.
For a robust measurement of variability, we calculated the average and the standard deviation over each season. Then, we also measured the photometry of the whole system (A + B + G)aperture using aperture photometry. The aperture photometry was calculated using two independent routines: a custom routine set up by our team, and the IRAF daophot package. As the results were robust and coherent between each other, we decided to normalize the averaged PSF fitting results to aperture photometry. We then calculated for each year a normalization parameter k = [(A + B + G)aperture − GHST] /(APSF + BPSF), and we corrected all PSF magnitudes for k. These averaged results are in agreement with the non normalized results, and are shown in Fig. 5 and in Table 3.
Furthermore, in Table 3 we list the magnitudes of “B+G” as a mere superposition of their fluxes. The contribution due to the galaxy “G” in the total flux of the unresolved component “B+G” is quite important: near 18%, 45% and 52% in the V, R and i bands, respectively.
We see an initial common behavior for the different filters and components: the flux slightly decreases between the 2008 and 2009 seasons, and increases between the 2009 and 2010 seasons. Then, during the 2011 season, the flux of the “A” component keeps increasing, while the “B” component slightly decreases.
In particular, in the V filter we notice a decrease in flux by 0.09 mag between the 2008 and 2009 seasons for the “A” component (corresponding to a decrease of 3σ), and an increase in flux by 0.10 mag between the two successive seasons (2009–2011). The flux of the “B” lensed component, as well as of “B+G”, slightly decreases in this filter over the four seasons, but not significantly.
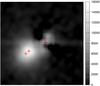 |
Fig. 3 Reconstructed image of the lens galaxy of UM673. Orientation, pixel scale and marks are the same as those shown in Fig. 2. See the text for the details relative to the reconstruction technique. |
In the R filter the behavior is the same: for the “A” component the flux decreases by 0.11 mag (above 3σ) between the first two seasons and successively increases by 0.11 mag between the 2009 and 2011 seasons. The flux of the “B” lensed component slightly decreases, as well as the flux of “B+G”, with a less significant amplitude.
Finally, in the i filter we notice less evident trends than detected in the other filters, excepted for the brighter “A” lensed component which presents a smaller decrease in flux between the first two seasons and a further increase by 0.10 mag between 2009 and 2011.
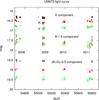 |
Fig. 4 Light curves in the VRi filters of the lensed components “A” and “B” of the gravitationally lensed quasar UM673. The plot also shows the “B+G” values. The “B” and “B+G” light curves have been shifted by − 1.5 and 0.5 mag, respectively. Typical errors of individual observations are near 0.02 and 0.05–0.08 mag for the “A” and “B” components, respectively. |
Our results are in good agreement with Koptelova et al. (2012) recent results for the same epochs (see the larger background symbols in Fig. 5). We obtain for the “A” lensed component a magnitude ≈ 0.02–0.08 larger for all the filters. The magnitudes of “B+G” are slightly smaller: within 2σ in the R and i bands. These differences might derive from using different techniques for PSF fitting and/or setting the photometric zero-points.
4.2. Color variations
From the data collected during the 2008, 2009, and 2011 seasons, we were able to build a color-color diagram to search for color variations of the two lensed components and of “B+G” with time. The results are shown in Fig. 6 and in Table 4.
All color variations over each epoch are found to be within the error bars. Our results also show that within these error bars the color indices of the “A” component and of “B+G” are coherent with the work of Koptelova et al. (2010b, 2012) data, and we find small variations with respect to HST data which are relative to 1994.
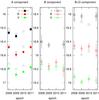 |
Fig. 5 Average light curves over the four seasons of observation for the two lensed components “A” and “B”. The “B+G” average light curve is also shown (see the text for details). The error bars indicate the standard deviation over the epoch. The larger background symbols show recent results independently obtained by Koptelova et al. (2012). |
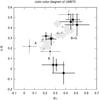 |
Fig. 6 Color–color diagram for the 2008, 2009 and 2011 seasons (black bold dots) of the two lensed components “A” and “B” of UM673. The “B+G” values are relative to the color indices of the “B” component that includes the contribution of the lens galaxy, as in the approach of Koptelova et al. (2010b). The diagram also includes HST (Muñoz et al. 1998) data (black light points) and Koptelova et al. (2010b) data (little gray points). The larger background symbols refer to the data from Koptelova et al. (2012). |
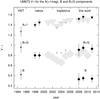 |
Fig. 7 Evolution of the V − i color index of “A” (triangles), “B” and “B+G” (rhombi) with time, including the data from HST (Muñoz et al. 1998), from Nakos et al. (2005), from Koptelova et al. (2010b) and from the present work. Adaptation of recently published data by Koptelova et al. (2012) is also shown (larger background symbols). The “A” component is shifted by + 1 mag. |
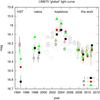 |
Fig. 8 “Global i” light curve of UM673 built by including data from HST (Muñoz et al. 1998), Nakos et al. (2005), Koptelova et al. (2010b) and the present work. An adaptation of recently published data by Koptelova et al. (2012) is also shown (larger background symbols). The technique used to build this curve is explained in detail in Sect. 4.3. In particular, filled and open symbols are used for the “A” and the “B+G” lensed components, respectively. |
Moreover, the temporal evolution of the color index between the observations of Koptelova et al. (2010b, 2012) and the current data shows a weak trend indicating that the quasar becomes redder as its flux decreases, as already observed in our multicolor study of the gravitationally lensed quasar HE 0435-1223 (Ricci et al. 2011b).
Galaxy “G” affects quite strongly the color of “B+G”. We find a difference of 0.17–0.13 mag between the R − i color index of “B+G” and “B”, a difference of 0.42–0.47 mag in V − R and of 0.59–0.60 mag in V − i. On the basis of HST data, corresponding differences in colors between the “B+G” and “B” components are 0.17, 0.37 and 0.54 (Lehár et al. 2000). This supports the view that the contribution of galaxy “G” cannot be neglected in any considered band.
Nakos et al. (2005) reduced UM673 data in the V and i filters by using three different techniques: MCS deconvolution, difference imaging, and PSF fitting. The first two techniques allow in principle to get rid of the contribution of “G”, while results obtained with PSF fitting are contaminated by the lens galaxy. Despite this, Nakos et al. (2005) results are coherent with each other. We compared their V − i color index obtained by the different methods. Nakos et al. (2005) obtained differences on the V − i color index between “B+G” and the “B” components smaller than 0.04 mag, which is comparable with their photometric errors. This is in contradiction with Lehár et al. (2000) results and our results, which lead to 0.54 and 0.59 − 0.60 mag, respectively. As it was shown above, the brightness of galaxy “G” cannot be neglected in the V, R or i bands. The contribution of galaxy “G” significantly changes the color of “B+G”.
In Fig. 7 we compare the evolution of the V − i color index with time, by using the data collected from HST (Muñoz et al. 1998), Nakos et al. (2005), and Koptelova et al. (2010b). An adaptation of recently published data by Koptelova et al. (2012) is also shown. We find good agreement with their data.
4.3. “Global i” light curve
A “global i” light curve which also includes the results of Muñoz et al. (1998), Nakos et al. (2005) and Koptelova et al. (2010b, 2012) is shown in Fig. 8. To construct this figure, first we shifted in time the light curve of “B+G” using the value of the time delay (89 days) provided by Koptelova et al. (2012). Then we calculated for each filter the average 2008 difference in magnitude between the two components, and we corrected the “B+G” light curve for these values. Finally, we corrected the V and R light curves of both components by their average 2008 V − i and R − i color indices, respectively. We chose the 2008 season as a reference only because it represents the beginning of our observations. Figure 8 shows that the flux of the quasar intrinsically varied over the different seasons, with an amplitude of ≈0.6 mag, peak-to-valley over the last two decades.
5. Conclusions
We have presented a photometric monitoring, carried out during four epochs in three different filters, of the doubly imaged quasar UM673.
The results show a significant decrease in flux of the “A” lensed component between the first two seasons (2008–2009), and a smaller increase between the successive three seasons (2009–2011). This behavior is mostly significant in the V and R bands.
Moreover, our observations are in good agreement with the previous works carried out by Muñoz et al. (1998), Koptelova et al. (2010b), and Koptelova et al. (2012) in terms of flux variations and color index. We also separated the contribution of the lens galaxy from the fainter lensed component, showing the effects of this operation on the color index of the latter. We conclude that the contribution of the lens galaxy in the photometry of UM673 cannot be neglected and we give an independent estimation of the magnitude of the lens galaxy.
Further observations could help in corroborating the separate color variations of the components, and the slight flux trend observed between the seasons.
UM673/Q0142-100, HE0435-1223, Q2237+0305, WFI2033-4723 and HE0047-1756.
More details are available at http://www.eso.org/lasilla/telescopes/d1p5/misc/dfosc_filters.html
Acknowledgments
This research was supported by ARC – Action de recherche concertée (Communauté Française de Belgique – Académie Wallonie-Europe). D.R. (boursier FRIA) acknlowledges GLObal Robotic telescopes Intelligent Array for e-Science (GLORIA), a project funded by the European Union Seventh Framework Programme (FP7/2007-2012) under grant agreement number 283783. A.E. is the beneficiary of a fellowship granted by the Belgian Federal Science Policy Office. A.E. is also grateful for partial support in the framework of the NASU Target Program “CosmoMicroPhysics”. N.K. received funding from the European Community’s Seventh Framework Programme (/FP7/2007-2013/) under grant agreement No 229517. M.D., M.H. and C.L. acknowledge the Qatar Foundation for support from QNRF grant NPRP-09-476-1-078. Operation of the Danish telescope is supported by the Danish National Science Research Council (FNU).
References
- Daulie, G., Hainaut, O., Hutsemekers, D., et al. 1993, in Liege International Astrophysical Colloq., 31, eds. J. Surdej, D. Fraipont-Caro, E. Gosset, S. Refsdal, & M. Remy, 181 [Google Scholar]
- Dominik, M., Jørgensen, U. G., Rattenbury, N. J., et al. 2010, Astron. Nach., 331, 671 [Google Scholar]
- Fadely, R., & Keeton, C. R. 2011, AJ, 141, 101 [NASA ADS] [CrossRef] [Google Scholar]
- Holtzman, J. A., Burrows, C. J., Casertano, S., et al. 1995, PASP, 107, 1065 [NASA ADS] [CrossRef] [Google Scholar]
- Koptelova, E., & Oknyanskij, V. 2010, The Open Astronomy Journal, 3, 184 [NASA ADS] [Google Scholar]
- Koptelova, E. A., Artamonov, B. P., Bruevich, V. V., Burkhonov, O. A., & Sergeev, A. V. 2008, Astron. Rep., 52, 270 [NASA ADS] [CrossRef] [Google Scholar]
- Koptelova, E., Oknyanskij, V., Artamonov, B., & Chen, W. 2010a, Mem. Soc. Astron. It., 81, 138 [NASA ADS] [Google Scholar]
- Koptelova, E., Oknyanskij, V. L., Artamonov, B. P., & Burkhonov, O. 2010b, MNRAS, 401, 2805 [NASA ADS] [CrossRef] [Google Scholar]
- Koptelova, E., Chen, W. P., Chiueh, T., et al. 2012, A&A, 544, A51 [Google Scholar]
- Lehár, J., Falco, E. E., Kochanek, C. S., et al. 2000, ApJ, 536, 584 [NASA ADS] [CrossRef] [Google Scholar]
- Lehár, J., Falco, E. E., Kochanek, C. S., et al. 2002, ApJ, 571, 1021 [NASA ADS] [CrossRef] [Google Scholar]
- Magain, P., Courbin, F., Gillon, M., et al. 2007, A&A, 461, 373 [NASA ADS] [CrossRef] [EDP Sciences] [Google Scholar]
- Muñoz, J. A., Falco, E. E., Kochanek, C. S., et al. 1998, Ap&SS, 263, 51 [NASA ADS] [CrossRef] [Google Scholar]
- Nakos, T., Ofek, E. O., Boumis, P., et al. 2003, A&A, 402, 1157 [NASA ADS] [CrossRef] [EDP Sciences] [Google Scholar]
- Nakos, T., Courbin, F., Poels, J., et al. 2005, A&A, 441, 443 [NASA ADS] [CrossRef] [EDP Sciences] [Google Scholar]
- Ricci, D., Poels, J., Elyiv, A., et al. 2011a, VizieR Online Data Catalog, J/A+A/528/A42 [Google Scholar]
- Ricci, D., Poels, J., Elyiv, A., et al. 2011b, A&A, 528, A42 [NASA ADS] [CrossRef] [EDP Sciences] [Google Scholar]
- Sinachopoulos, D., Nakos, T., Boumis, P., et al. 2001, AJ, 122, 1692 [NASA ADS] [CrossRef] [Google Scholar]
- Smette, A., Surdej, J., Shaver, P. A., et al. 1990, in Gravitational Lensing, eds. Y. Mellier, B. Fort, & G. Soucail, Lect. Notes Phys. (Berlin: Springer Verlag), 360, 122 [Google Scholar]
- Smette, A., Surdej, J., Shaver, P. A., et al. 1992, ApJ, 389, 39 [NASA ADS] [CrossRef] [Google Scholar]
- Surdej, J., Magain, P., Swings, J., et al. 1987, Nature, 329, 695 [Google Scholar]
- Surdej, J., Magain, P., Swings, J., et al. 1988, A&A, 198, 49 [NASA ADS] [Google Scholar]
- Wambsganss, J. 2006, in Saas-Fee Advanced Course 33: Gravitational Lensing: Strong, Weak and Micro, eds. G. Meylan, P. Jetzer, P. North, et al., 453 [Google Scholar]
- Wisotzki, L., Becker, T., Christensen, L., et al. 2004, Astron. Nach., 325, 135 [Google Scholar]
All Tables
All Figures
|
Fig. 1 DFOSC V filter image, taken on 2008-08-03, showing the position of UM673 and the stars “R”, “S”, “T”, “U”, and “V” used to search for a suitable reference star. The “V” star was finally chosen. “G1” and “G2” are field galaxies. The inset zoom shows the two components “A” and “B” of the lensed quasar. |
| In the text | |
|
Fig. 2 Composite image of UM673 obtained by superposing the 44 best quality CCD images in the R filter, resampled by dividing each pixel in a grid of 20 × 20 subpixels and recentering the images with an accuracy of one new subpixel. The positions of the components, provided by HST, are also shown. |
| In the text | |
|
Fig. 3 Reconstructed image of the lens galaxy of UM673. Orientation, pixel scale and marks are the same as those shown in Fig. 2. See the text for the details relative to the reconstruction technique. |
| In the text | |
|
Fig. 4 Light curves in the VRi filters of the lensed components “A” and “B” of the gravitationally lensed quasar UM673. The plot also shows the “B+G” values. The “B” and “B+G” light curves have been shifted by − 1.5 and 0.5 mag, respectively. Typical errors of individual observations are near 0.02 and 0.05–0.08 mag for the “A” and “B” components, respectively. |
| In the text | |
|
Fig. 5 Average light curves over the four seasons of observation for the two lensed components “A” and “B”. The “B+G” average light curve is also shown (see the text for details). The error bars indicate the standard deviation over the epoch. The larger background symbols show recent results independently obtained by Koptelova et al. (2012). |
| In the text | |
|
Fig. 6 Color–color diagram for the 2008, 2009 and 2011 seasons (black bold dots) of the two lensed components “A” and “B” of UM673. The “B+G” values are relative to the color indices of the “B” component that includes the contribution of the lens galaxy, as in the approach of Koptelova et al. (2010b). The diagram also includes HST (Muñoz et al. 1998) data (black light points) and Koptelova et al. (2010b) data (little gray points). The larger background symbols refer to the data from Koptelova et al. (2012). |
| In the text | |
|
Fig. 7 Evolution of the V − i color index of “A” (triangles), “B” and “B+G” (rhombi) with time, including the data from HST (Muñoz et al. 1998), from Nakos et al. (2005), from Koptelova et al. (2010b) and from the present work. Adaptation of recently published data by Koptelova et al. (2012) is also shown (larger background symbols). The “A” component is shifted by + 1 mag. |
| In the text | |
|
Fig. 8 “Global i” light curve of UM673 built by including data from HST (Muñoz et al. 1998), Nakos et al. (2005), Koptelova et al. (2010b) and the present work. An adaptation of recently published data by Koptelova et al. (2012) is also shown (larger background symbols). The technique used to build this curve is explained in detail in Sect. 4.3. In particular, filled and open symbols are used for the “A” and the “B+G” lensed components, respectively. |
| In the text | |
Current usage metrics show cumulative count of Article Views (full-text article views including HTML views, PDF and ePub downloads, according to the available data) and Abstracts Views on Vision4Press platform.
Data correspond to usage on the plateform after 2015. The current usage metrics is available 48-96 hours after online publication and is updated daily on week days.
Initial download of the metrics may take a while.