Fig. 5
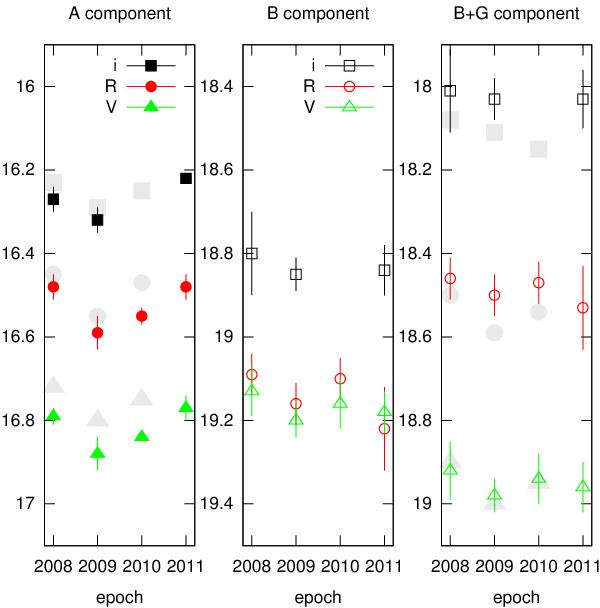
Average light curves over the four seasons of observation for the two lensed components “A” and “B”. The “B+G” average light curve is also shown (see the text for details). The error bars indicate the standard deviation over the epoch. The larger background symbols show recent results independently obtained by Koptelova et al. (2012).
Current usage metrics show cumulative count of Article Views (full-text article views including HTML views, PDF and ePub downloads, according to the available data) and Abstracts Views on Vision4Press platform.
Data correspond to usage on the plateform after 2015. The current usage metrics is available 48-96 hours after online publication and is updated daily on week days.
Initial download of the metrics may take a while.