Fig. 6
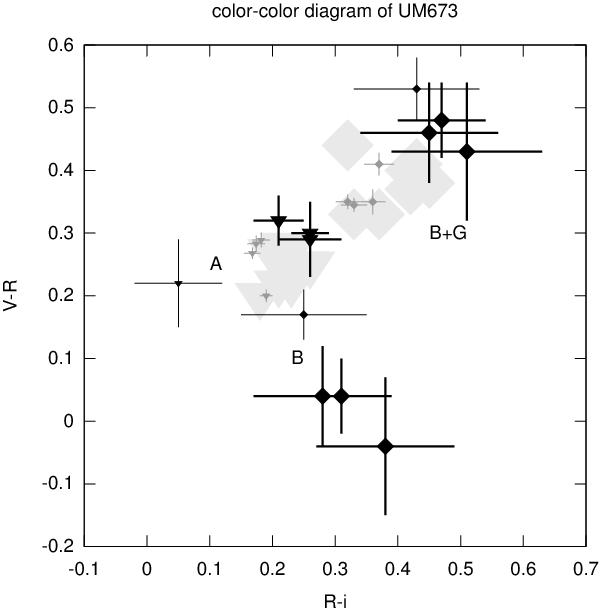
Color–color diagram for the 2008, 2009 and 2011 seasons (black bold dots) of the two lensed components “A” and “B” of UM673. The “B+G” values are relative to the color indices of the “B” component that includes the contribution of the lens galaxy, as in the approach of Koptelova et al. (2010b). The diagram also includes HST (Muñoz et al. 1998) data (black light points) and Koptelova et al. (2010b) data (little gray points). The larger background symbols refer to the data from Koptelova et al. (2012).
Current usage metrics show cumulative count of Article Views (full-text article views including HTML views, PDF and ePub downloads, according to the available data) and Abstracts Views on Vision4Press platform.
Data correspond to usage on the plateform after 2015. The current usage metrics is available 48-96 hours after online publication and is updated daily on week days.
Initial download of the metrics may take a while.