Fig. 8
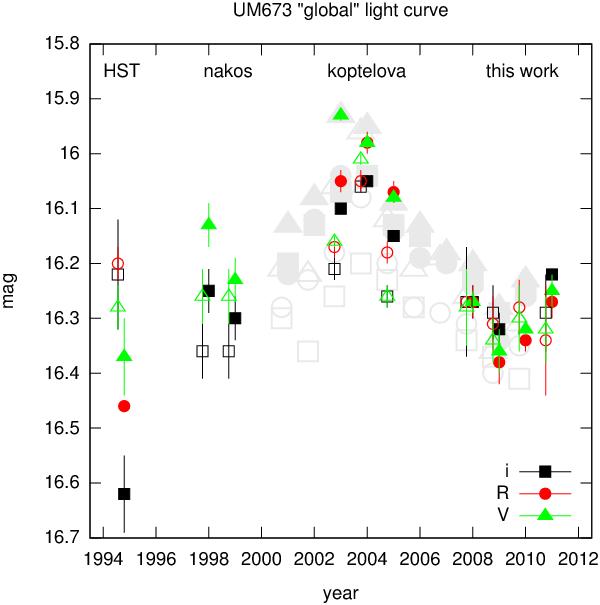
“Global i” light curve of UM673 built by including data from HST (Muñoz et al. 1998), Nakos et al. (2005), Koptelova et al. (2010b) and the present work. An adaptation of recently published data by Koptelova et al. (2012) is also shown (larger background symbols). The technique used to build this curve is explained in detail in Sect. 4.3. In particular, filled and open symbols are used for the “A” and the “B+G” lensed components, respectively.
Current usage metrics show cumulative count of Article Views (full-text article views including HTML views, PDF and ePub downloads, according to the available data) and Abstracts Views on Vision4Press platform.
Data correspond to usage on the plateform after 2015. The current usage metrics is available 48-96 hours after online publication and is updated daily on week days.
Initial download of the metrics may take a while.