Fig. 13
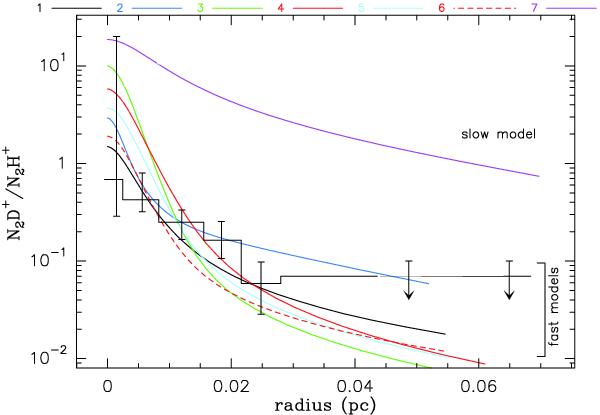
Comparison between different models output for the peak density matching the observations and the N2D+/N2H+ local abundance ratio derived from the L183 observations (from Pagani et al. 2007). The error bars represent the maximum (resp. minimum) ratios using the maximum (resp. minimum) N2D+ abundance profile compared to the minimum (resp. maximum) N2H+ abundance profile as displayed in Fig. 4b of Pagani et al. (2007). The 7 models are listed in Table 1. The x axis is the cylindrical radius.
Current usage metrics show cumulative count of Article Views (full-text article views including HTML views, PDF and ePub downloads, according to the available data) and Abstracts Views on Vision4Press platform.
Data correspond to usage on the plateform after 2015. The current usage metrics is available 48-96 hours after online publication and is updated daily on week days.
Initial download of the metrics may take a while.