| Issue |
A&A
Volume 551, March 2013
|
|
|---|---|---|
| Article Number | A38 | |
| Number of page(s) | 22 | |
| Section | Interstellar and circumstellar matter | |
| DOI | https://doi.org/10.1051/0004-6361/201117161 | |
| Published online | 18 February 2013 | |
Online material
Appendix A: The new H2 + H+ rate impact
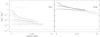 |
Fig. A.1
Evolution of the N2D+/N2H+ ratio with the old H2 + H+, for the slow (right) and fast (left) models. The dashed lines trace the reference results (from Fig. 5). The dotted line traces the new versus reference model ratio for the last epoch (corresponding to a peak density of 2 × 106 cm-3) in each frame. |
| Open with DEXTER | |
It is interesting to check the importance of the new ortho-to-para conversion rate of H2 on the deuteration efficiency because this conversion rate is the prime ruler among chemical reaction rates on the evolutionary time of the chemistry. Figure A.1 shows the deceleration of the deuteration with the new rate (which is the reference case, i.e. the dashed lines) compared to the old rate (Gerlich 1990, which is the test case here, i.e. the full lines). The difference in deuteration is a factor of 3 for the fast case. There is, however, almost no difference for the slow case, which has already reached steady state, even more so with the old, faster rate.
Appendix B: The D2H+/H2D+ ratio
We study in this appendix the sensitivity of the
para-D2H+/ortho-H2D+ (hereafter PDOH)
ratio to the different parameter variations we have studied in the main text. The
difficulty observing those lines from the ground makes them of limited interest as a
tool for studying cold cores, but they are nevertheless interesting values when such
observations have been achieved, because these are basically the only
 isotopologues observable from the ground. Their ortho and para counterparts are above 1
THz and are difficult to detect due to the large energy difference between the upper and
ground levels, which is incompatible with the low temperature needed to have these
species produced in large quantities. Their detection in absorption would require a
strong background source, not available in all the presently known PSCs. Among the rare
detections, an interesting mapping of D2H+ has been reported by
Parise et al. (2011).
isotopologues observable from the ground. Their ortho and para counterparts are above 1
THz and are difficult to detect due to the large energy difference between the upper and
ground levels, which is incompatible with the low temperature needed to have these
species produced in large quantities. Their detection in absorption would require a
strong background source, not available in all the presently known PSCs. Among the rare
detections, an interesting mapping of D2H+ has been reported by
Parise et al. (2011).
The parameters are varied in the same order as in Sect. 5 for the N2D+/N2H+ modelling.
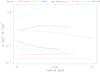 |
Fig. B.1
Evolution of the para-D2H+/ortho-H2D+ ratio with time for the slow (dashed lines) and fast (full lines) reference models. The dotted line traces the slow/fast ratio for the last epoch (corresponding to a peak density of 2 × 106 cm-3). The results are traced for the same density profiles as those in Fig. 2 |
| Open with DEXTER | |
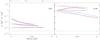 |
Fig. B.2
Evolution of the para-D2H+/ortho-H2D+ ratio with temperature for the slow (right) and fast (left) models. In the reference model, the temperature of the chemical network is the temperature of the gas. The two other cases are for constant temperature imposed on the chemical network. To better see the differences, the reference model has been drawn with the full line mode (from respectively the slow and fast cases displayed in Fig. B.1). The results are traced for the same density profiles as those in Fig. 2. |
| Open with DEXTER | |
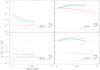 |
Fig. B.3
Evolution of the para-D2H+/ortho-H2D+ ratio with time for the slow (right) and fast (left) models as a function of CO depletion (depletion multiplied by 2 in the top row, divided by 5 in the bottom row). The dashed lines trace the reference results (from respectively the slow and fast cases displayed in Fig. B.1). The dotted line traces the new versus reference model ratio for the last epoch (corresponding to a peak density of 2 × 106 cm-3) in each frame. The results are traced for the same density profiles as those in Fig. 2. |
| Open with DEXTER | |
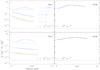 |
Fig. B.4
Evolution of the para-D2H+/ortho-H2D+ ratio with the H2 OPR for the slow (right) and fast (left) models. The bottom row corresponds to the density profile with peak density of 105 cm-3 and the top row to the profile with peak density of 2 × 106 cm-3 (from Fig. 2). OPR values are listed in the top left image. The dashed lines trace the reference results (from Fig. B.1). |
| Open with DEXTER | |
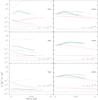 |
Fig. B.5
Evolution of the para-D2H+/ortho-H2D+ ratio when the cosmic ray ionization rate is multiplied by 3 (bottom row) and by 10 (top row) for the slow (right) and fast (left) models. The dotted line traces the new versus reference model ratio for the last epoch (corresponding to a peak density of 2 × 106 cm-3) in each frame. The dashed lines trace the reference results (from Fig. B.1). |
| Open with DEXTER | |
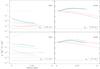 |
Fig. B.6
Evolution of the para-D2H+/ortho-H2D+ ratio when the grain size is multiplied by 3 (bottom row) or divided by 2 (top row) for the slow (right) and fast (left) models. The dashed lines trace the reference results (from Fig. B.1). The dotted line traces the new versus reference model ratio for the last epoch (corresponding to a peak density of 2 × 106 cm-3) in each frame. |
| Open with DEXTER | |
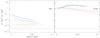 |
Fig. B.7
Evolution of the para-D2H+/ortho-H2D+ ratio with the old H2 + H+, for the slow (right) and fast (left) models. The dashed lines trace the reference results (from Fig. B.1). The dotted line traces the new versus reference model ratio for the last epoch (corresponding to a peak density of 2 × 106 cm-3) in each frame. |
| Open with DEXTER | |
Comments on the different figures.
Unlike the N2D+/N2H+ ratio evolution
with time, the PDOH ratio evolution is not forcibly monotonic because both species are
transient from to
 , and the
two species are directly connected via chemical reactions (for
N2D+ and N2H+, this is true only for
reactions with H and D atoms, which play a minor role). Indeed, in the reference case
(Fig. B.1), this PDOH ratio first increases at
all radial distances in a similar manner and then, in the slow case, drops in the
inner 0.02 pc part with time. For the final density profile, the ratio is 5 to
300 times higher in the slow case than in the fast case. The latter has clearly not
reached steady state.
, and the
two species are directly connected via chemical reactions (for
N2D+ and N2H+, this is true only for
reactions with H and D atoms, which play a minor role). Indeed, in the reference case
(Fig. B.1), this PDOH ratio first increases at
all radial distances in a similar manner and then, in the slow case, drops in the
inner 0.02 pc part with time. For the final density profile, the ratio is 5 to
300 times higher in the slow case than in the fast case. The latter has clearly not
reached steady state.
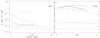 |
Fig. B.8
Evolution of the para-D2H+/ortho-H2D+ ratio when CO depletion is varying compared to constant depletion, for the slow (right) and fast (left) models. The dashed lines trace the reference results (from Fig. B.1) and the dotted line traces the new versus reference model ratio for the last epoch (corresponding to a peak density of 2 × 106 cm-3) in each frame. |
| Open with DEXTER | |
The sensitivity to temperature is slightly greater than for the N2D+/N2H+ ratio in the slow case (compare Figs. B.2a and 6) in a non-obvious fashion. The sensitivity to CO abundance follows expectations (Fig. B.3). When CO abundance increases, it reacts with a larger quantity of H2D+ ions, directly competing with HD to form HCO+ and DCO+ rather than D2H+. It is also visible in the slow process when the CO abundance is increased.
The initial OPR ratio at collapse start has the same influence on the PDOH ratio as on the N2D+/N2H+ ratio (Figs. B.4 vs. 9); i.e., as the initial OPR ratio is lowered, the chemistry approaches the steady state more and more. The slow case is already in steady-state and does not show any change at all.
Figure B.5 (cosmic ray ionization rate dependence) shows a strongly non-linear behaviour along the core radius and when the cosmic ray ionization rate is increased. In the fast collapse case, for ζ = 1 × 10-16 s-1, steady state is reached when arriving at the highest density after passing by a higher ratio value in the centre. The ratio has therefore not evolved monotonically.
For an average grain smaller than 0.1 μm, we find results similar to the N2D+/N2H+ ratio case (Figs. B.6 vs. 11), with a small decrease in the deuteration efficiency for the fast case and almost no change for the slow case. For large grains, the fast case shows a strong amplification, and for the slow case, the behaviour is non-linear, marking a small increase first and then a small decrease in the ratio.
The last two cases (sensitivity to the old H2 + H+ reaction rate, Fig. B.7, and to variable CO depletion, Fig. B.8) show the same behaviours as those reported for the N2D+/N2H+ ratio cases (Figs. A.1 and 8).
Overall, in the fast collapse case, the PDOH ratio remains almost always below 1 while it varies from 1 in the centre to ~5 at distances around 0.03–0.05 pc away from it for the slow case but some ambiguity can appear in several cases. In both the fast and the slow cases, the variation in the PDOH ratio can be non-monotonic and therefore not a good constraint to differentiate between the models.
Appendix C: Kooij/Arrhenius expression of the Hugo H + H2 isotopologues reaction rates and of the
H
isotopologues dissociative recombination rates2
+ H2 isotopologues reaction rates and of the
H
isotopologues dissociative recombination rates2
Hugo et al. (2009) fit their
+
H2 isotopologue reaction rate tables with the Arrhenius formula
(K = αe−β/T cm3 s-1).
However, they have validated their fits only in the 5–20 K temperature range. By
employing the more complete Kooij/Arrhenius formula
(K = α(T/300 K)βe−γ/T cm3 s-1)
and adjusting the coefficients by hand, we can provide a fit extending up to 50 K, the
maximum temperature given in Hugo et al. (2009)
tables, to a sufficient precision (<±10%). To compute the
Kooij/Arrhenius coefficients, we loaded the tabulated values (between 5 and 50 K), and
fitted the first two terms of the formula (α,β) by eye after
multiplying the rate by
eγ/T for the endothermic
reactions. We minimized the errors to keep them to a few % only over all the temperature
range. Figures C.1–C.3 show two examples of a fit. Figures C.1–C.2 show the fitting of an
endothermic reaction. At very low temperatures, the endothermic reaction coefficients
become low enough to drop below 10-20 and are zeroed in Hugo et al. (2009) reaction files. These values therefore remain
zeroed when corrected for the endothermicity (Fig. C.1) and cannot be recovered and used for the fit. The fit extrapolation is,
however, good enough, and its possible error is largely attenuated by the strong
endothermic correction (Fig. C.2), which makes the
rate drop quickly. In some cases, the Kooij formula cannot fit the data. Figure C.3 shows such a case for an exothermic reaction. The
fit is minimized so that the maximum error is the same in the middle and at the two ends
of the slope. The error remains lower than ±10% for all rates within the 5–50 K range
compared to the tabulated values. The Kooij/Arrhenius coefficients are given in
Table C.1.
In Table C.2, we present the Kooij/Arrhenius
coefficients of the dissociative recombination rates of the
isotopologues from P09.
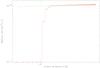 |
Fig. C.1
Fit for the reaction m- |
| Open with DEXTER | |
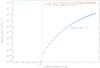 |
Fig. C.2
Same as Fig. C.1 but with a different Y-scale. The original rate is plotted in dark blue and the fit in cyan is the green fit equation with the endothermic correction (e−206/Tkin) reintroduced. The fit is good even for the departing first non-zeroed rates at low Tkin. |
| Open with DEXTER | |
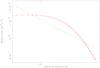 |
Fig. C.3
Fit for the reaction o-D2H+ + HD →
o- |
| Open with DEXTER | |
Kooij/Arrhenius coefficients of the +
H2 isotopologues reactions.
continued.
Kooij/Arrhenius coefficients of the dissociative recombination rates of the
isotopologues from P09.
© ESO, 2013
Current usage metrics show cumulative count of Article Views (full-text article views including HTML views, PDF and ePub downloads, according to the available data) and Abstracts Views on Vision4Press platform.
Data correspond to usage on the plateform after 2015. The current usage metrics is available 48-96 hours after online publication and is updated daily on week days.
Initial download of the metrics may take a while.