Fig. 4
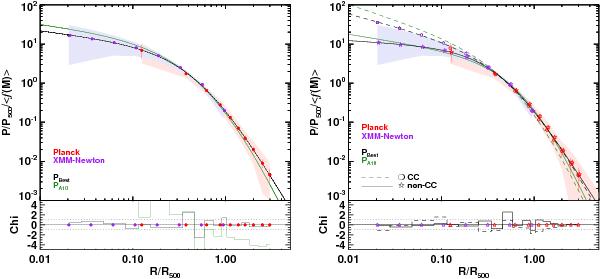
Left: Planck pressure profile obtained from the average of the individual pressure profiles across our sample (red points) shown together with the stacked pressure profile derived from the XMM-Newton data for the same sample (purple points). The dispersions about the SZ and X-ray profiles are depicted, respectively, by the red and purple shaded areas. Our best fit GNFW profile is shown as a solid black line and that of A10 as a solid green line. The lower panel shows the χ profile of these two best models taking into account the statistical errors and dispersion about the observed profile. Right: stacked profile from Planck and XMM-Newton for the sub-samples of cool-core (open circles) and non cool-core (open stars) clusters within the ESZ-XMM sample. The shaded areas are identical to the one shown in the left panel. Our best fit models for each sub-sample are shown as black solid and dashed lines for the cool-core and non cool-core clusters, respectively (see Table 1). The best A10 fit for cool-core and non cool-core clusters are shown as green solid and dashed lines, respectively. The lower panel gives the χ profiles of our best fit models with respect to the measured profiles and associated errors (including dispersion). On both panels the Planck data points are correlated at about the 20% level (see Sect. 4.3.1). As for the stacked SZ profile, the error bars on the Planck points are purely statistical and correspond to the square root of the diagonal elements of the covariance matrix. For the XMM-Newton points they correspond to the statistical error on mean.
Current usage metrics show cumulative count of Article Views (full-text article views including HTML views, PDF and ePub downloads, according to the available data) and Abstracts Views on Vision4Press platform.
Data correspond to usage on the plateform after 2015. The current usage metrics is available 48-96 hours after online publication and is updated daily on week days.
Initial download of the metrics may take a while.