| Issue |
A&A
Volume 549, January 2013
|
|
|---|---|---|
| Article Number | L3 | |
| Number of page(s) | 5 | |
| Section | Letters | |
| DOI | https://doi.org/10.1051/0004-6361/201220638 | |
| Published online | 12 December 2012 | |
Warm water deuterium fractionation in IRAS 16293-2422⋆
The high-resolution ALMA and SMA view
1 Centre for Star and Planet Formation, Natural History Museum of Denmark, University of Copenhagen, Øster Voldgade 5-7, 1350 Copenhagen K, Denmark
e-mail: magnusp@nbi.dk
2 Niels Bohr Institute, University of Copenhagen, Juliane Maries Vej 30, 2100 Copenhagen Ø, Denmark
3 Leiden Observatory, Leiden University, PO Box 9513, 2300 RA Leiden, The Netherlands
4 Max-Planck Institute für extraterrestrische Physik (MPE), Giessenbachstrasse, 85748 Garching, Germany
Received: 26 October 2012
Accepted: 28 November 2012
Context. Measuring the water deuterium fractionation in the inner warm regions of low-mass protostars has so far been hampered by poor angular resolution obtainable with single-dish ground- and space-based telescopes. Observations of water isotopologues using (sub)millimeter wavelength interferometers have the potential to shed light on this matter.
Aims. To measure the water deuterium fractionation in the warm gas of the deeply-embedded protostellar binary IRAS 16293-2422.
Methods. Observations toward IRAS 16293-2422 of the 53,2 − 44,1 transition of H218O at 692.07914 GHz from Atacama Large Millimeter/submillimeter Array (ALMA) as well as the 31,3 − 22,0 of H218O at 203.40752 GHz and the 31,2 − 22,1 transition of HDO at 225.89672 GHz from the Submillimeter Array (SMA) are presented.
Results. The 692 GHz H218O line is seen toward both components of the binary protostar. Toward one of the components, “source B”, the line is seen in absorption toward the continuum, slightly red-shifted from the systemic velocity, whereas emission is seen off-source at the systemic velocity. Toward the other component, “source A”, the two HDO and H218O lines are detected as well with the SMA. From the H218O transitions the excitation temperature is estimated at 124 ± 12 K. The calculated HDO/H2O ratio is (9.2 ± 2.6) × 10-4 – significantly lower than previous estimates in the warm gas close to the source. It is also lower by a factor of ~5 than the ratio deduced in the outer envelope.
Conclusions. Our observations reveal the physical and chemical structure of water vapor close to the protostars on solar-system scales. The red-shifted absorption detected toward source B is indicative of infall. The excitation temperature is consistent with the picture of water ice evaporation close to the protostar. The low HDO/H2O ratio deduced here suggests that the differences between the inner regions of the protostars and the Earth’s oceans and comets are smaller than previously thought.
Key words: astrochemistry / stars: formation / protoplanetary disks / ISM: abundances / ISM: general
Appendix A is available in electronic form at http://www.aanda.org
© ESO, 2012
1. Introduction
Water plays an essential role for life as we know it, but its origin on Earth is still unclear: was water accreted during the early stages of Earth’s formation, or brought by smaller solar system bodies such as comets at later times? To deduce the origin of Earth’s water and the amount of chemical processing it has experienced, one option is to measure the water deuterium fractionation (HDO/H2O) during different stages in the evolution of protostars and compare it to what we measure in Earth’s oceans and comets.
Generally the HDO/H2O ratio in Earth’s oceans of 3 × 10⁻⁴ (e.g., Lécuyer et al. 1998) and Oort cloud comets of 8.2 × 10⁻⁴ (Villanueva et al. 2009) are found to be enhanced above the D/H1 ratio in the protosolar nebula ~1.5 × 10⁻⁵ (Linsky 2003; Geiss & Gloeckler 1998) due to deuterium fractionation processes. The factor of 2 higher abundance ratio in the Oort cloud comets than in Earth’s oceans has previously been taken as an indication that only a small fraction of Earth’s water was delivered by comets. Recently however, a HDO/H2O ratio of 3.2 × 10⁻⁴ was measured for the Jupiter class comet Hartley 2 with the Herschel Space Observatory (Hartogh et al. 2011) and 4.2 × 10⁻⁴ for the Oort cloud comet Garradd (Bockelée-Morvan et al. 2012), indicating values closer to those of Earth’s water.
Attempts at measuring the water deuterium fractionation in protostars have resulted in different conclusions. Parise et al. (2003) used ground-based infrared observations of the stretching bands of OH and OD in water ice in the outer parts of envelopes and found upper limits ranging from 0.5% to 2% for the HDO/H2O ratios in four embedded low-mass protostars. In the gas-phase it is possible to detect lines of HDO, but such studies differ on the interpretation with HDO/H2O ratios in protostars ranging from cometary values (Stark et al. 2004), to a few % (Parise et al. 2005; Liu et al. 2011). Even more recently, Coutens et al. (2012) deduced a HDO/H2O ratio in IRAS 16293-2422 of 3.4 × 10⁻² in the inner parts and 0.5 × 10⁻² in the outer envelope by modeling a large range of lines observed with Herschel.
One problem with previous measurements of HDO/H2O is the relatively large beam size of single-dish ground- and space-based telescopes. Spherically symmetric power-law models of protostellar envelopes have usually been employed to interpret the observations. While such models are appropriate to interpret continuum and line emission on larger scales (>300 AU), they are not suited to unambiguously analyze the observed compact components since there are clear indications that they are not an accurate representation of the conditions on small scales (e.g., Jørgensen et al. 2005; Chiang et al. 2012). Estimates of abundance ratios on these smaller scales are thus subject to significant uncertainties due to extrapolations of the underlying physical structures.
High angular resolution millimeter wavelength aperture synthesis observations offer a possibility to circumvent this issue. Recently Jørgensen & van Dishoeck (2010) detected the water isotopologue H218O toward the deeply embedded protostar NGC-1333 IRAS4B on scales of <50 AU using the IRAM Plateau de Bure Interferometer (PdBI), which combined with an upper limit on the HDO column density from the SMA resulted in a 3σ upper limit to the HDO/H2O abundance ratio of 6 × 10⁻⁴. To follow-up these results we initiated an extended survey of the H218O and HDO emission on arcsecond scales using the IRAM PdBI and SMA (Persson et al. 2012).
IRAS 16293-2422 is a Class 0 protostellar binary (sep ~ 5″, 600 AU) located 120 pc away in the LDN 1689N cloud in the ρ Ophiucus star-forming region (Knude & Høg 1998; Loinard et al. 2008). With a rich spectrum at (sub)millimeter wavelengths (Blake et al. 1994; van Dishoeck et al. 1995; Cazaux et al. 2003; Chandler et al. 2005; Caux et al. 2011; Jørgensen et al. 2011) it has been one of the prime targets for studies of astrochemistry during the star-formation process, revealing the presence of a range of complex organic species (Bottinelli et al. 2004; Kuan et al. 2004; Bisschop et al. 2008) and prebiotic molecules (Jørgensen et al. 2012) on (sub)arcsecond scales.
In this letter we present, for the first time, high-resolution ground-based observations of several isotopologues of water toward IRAS 16293-2422 with both the ALMA (~0 2; 24 AU) and the SMA (~23; 276 AU). We derive direct, model-independent estimates of the water excitation temperature and use it to calculate the column density and the HDO/H2O ratio in the warm inner envelope.
2. Observations
Observations of the deeply-embedded low-mass protostellar binary IRAS 16293-2422 were carried out at 690 GHz with ALMA and 230 GHz with the SMA, targeting the 53,2 − 44,1 (692.07914 GHz) and 31,3 − 22,0 (203.40752 GHz) transitions of H218O and the 31,2 − 22,1 (225.89672 GHz) transition of HDO (see Table A.1 in the Appendix). In the tables, the 203 GHz observations are indicated with “1”, 225 GHz observations with “2” and 692 GHz with “3” (see Tables 1 and A.1)
The ALMA observations of IRAS 16293-2422 were conducted as part of the ALMA Science Verification (SV) program: IRAS 16293-2422 was observed with 13 antennas on April 16 and 17, 2012 in a seven pointing mosaic centered at ,  (J2000). The observations cover projected baselines from 26 to 402 m (62 to 945 kλ). One of the basebands was centered at 691.299 GHz with a bandwidth of 1.875 GHz and a spectral resolution of 0.923 MHz (0.4 km s-1), a setup that covers the H218O 53,2 − 44,1 line at 692.07914 GHz. Calibration observations include the quasars 1924-292 and 3c279 for the bandpass, the asteroid Juno for the amplitude, and the quasars 1625-254 and nrao530 for the phase. The science verification data are available as calibrated uv-data sets, which were used in our analysis. The calibrated data were imaged using the CASA software package (McMullin et al. 2007).
The lower-lying excited H218O 31,3 − 22,0 transition at 203.4075 GHz was observed with the SMA on May 1, 2011 in the compact configuration with seven antennas. This configuration resulted in projected baselines between 9 and 69 m (6 to 47 kλ). The passband was calibrated by observations of the quasar 3c279 while the absolute flux and complex gains were calibrated by observing Titan and the quasars 3c279, 1517-243 and 1626-298. The raw data calibration followed the standard recipes using the MIR package (Qi 2008) and then MIRIAD (Sault et al. 1995) was used to subtract the continuum from the data to create continuum-free line maps.
Finally, we utilized SMA observations of the HDO 31,2 − 22,1 line at 225.89672 GHz from the SMA (Jørgensen et al. 2011): those observations have a spectral resolution of 0.41 MHz (0.54 km s-1) and cover the projected baselines between 8.6−119.6 m (6.5−90 kλ). For further information about those observations we refer to Jørgensen et al. (2011). The resulting beam size, field of view, velocity resolution and RMS of the various line data are summarized in Table A.1 in the Appendix.
3. Results
Figure 1 shows the spectra around the water lines toward the continuum peaks with Gaussian fits. Source A is in itself a binary (Chandler et al. 2005) and we here refer to the components as A1 (the northeast component) and A2 (the southwest component) and the lower resolution single component as A. Both H218O lines are clearly detected toward source A in emission, while only the 692 GHz H218O line is seen toward source B in absorption. The H218O emission is clearly associated with peak A1 in the 692 GHz data. The H218O 692 GHz absorption line toward the continuum peak of source B is narrow and marginally red-shifted; the absorption is not due to the broad outflow seen in some lines (Jørgensen et al. 2011).
This weak absorption feature is not seen in the SMA data but the high sensitivity of ALMA combined with the stronger continuum at high frequencies is enough to detect it. The lines were identified using the JPL and CDMS catalogs through the Splatalogue compilation (Pickett et al. 1998; Müller et al. 2001).
The Splatalogue compilation shows no other possible line candidates at least ± 1 km s-1 from the line peak positions of the H218O line at 203 GHz and the HDO line at 225 GHz. Lines that fall within ± 2 − 3 km s-1 exist, but are of too low intrinsic line strengths or lack additional components that should have been detected at other velocity offsets e.g., (CH3)2CO, 13CH3CH2CN or C6H. At 203.403 and 203.410 GHz (i.e., about 10 and − 3 km s-1) lies CH3OCH3 33,1 − 22,1EA/EE, which is accounted for when fitting the 203 GHz line. These lines are narrow enough to avoid any significant interference with H218O (see top most plot in Fig. 1).
For the H218O ALMA data at 692 GHz the line identification in source A is complicated by the fact that the source is resolved and shows a systematic velocity pattern in other lines (Pineda et al. 2012). The line toward the continuum position of source A is red-shifted by about 2 km s-1 from the systemic vLSR of 3.2 km s-1, similar to lines from other species (see Fig. 1, panel four). The third spectrum from the top in Fig. 1 shows the spectrum after smoothing with a Gaussian kernel of 1′′ size. The Gaussian fit to these data peaks closer to vLSR = 3.2 km s-1, indicative indeed of resolved velocity structure. Outflow emission (cf., Loinard et al. 2012), as also seen in H2O masers on small scales (Alves et al. 2012), could explain this velocity shift, but it is not possible to deduce its importance from the current data.
However, another possibility is that line blending causes the shift. Toward source B, the off position spectrum shows two emission lines, the second line at ~6 km s-1 is unidentified (bottom spectrum Fig. 1). The H218O line at 692 GHz toward source A may therefore also be affected by line blending. However, the unambiguous detection of the 692 GHz line toward source B and the SMA observations of water toward source A suggest that at least half of the 692 GHz feature toward source A is indeed due to the H218O line.
Table 1 lists parameters from Gaussian fits to the image and uv-plane of the line emission. The integrated intensity maps for the detected water lines are shown in Fig. 2.
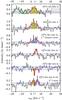 |
Fig. 1 Spectra of the targeted water lines toward both IRAS 16293-2422 A and B. The 203 GHz H218O line spectrum (top) was binned to twice the resolution for clarity. The 1D Gaussian fits (red: H218O; green: CH3OCH3; magenta: unidentified) and the RMS (blue) are plotted. Shaded areas show the interval over which the integrated intensities have been calculated (yellow and blue). The dotted green vertical lines shows vLSR = 3.2 and 2.7 km s-1 for source A and B respectively. The third spectrum from the top (blue fill) is from data smoothed with a 1′′ Gaussian kernel. |
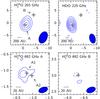 |
Fig. 2 Integrated intensity maps for all observed water lines calculated from channels ± 3 from the systemic velocity, deduced from previous observations (Jørgensen et al. 2011). The absorption line toward source B was integrated in the interval 0−5 km s-1. Note the different spatial scales of the top vs the bottom panels. The beam is shown in the lower right corner and the gray crosses show the position of continuum peaks from elliptical Gaussian fits. Units on the axes are offset in arcseconds from the phase center of the 203 GHz observations. Contours are in steps of 2σ starting at 3σ, dashed contours represent negative values. |
Parameters from fits to the integrated maps and spectra of the different water lines for source A and B.
4. Discussion
4.1. Spectra and integrated intensity
The different water lines toward source A show similar characteristics. The peak positions and line widths of the Gaussian fits to the 203 GHz H218O and 225 GHz HDO lines are similar and agree with previous studies of other molecules toward IRAS 16293-2422 e.g., Bisschop et al. (2008); Jørgensen et al. (2011); Jørgensen et al. (2012); Pineda et al. (2012) (see Table 1). The mapped emission is compact and traces the warm water on scales R < 200 AU.
Toward source B, the 692 GHz H218O line is detected in absorption. The spectral line is slightly red-shifted compared with vLSR = 2.7 km s-1 of source B, consistent with the picture of ongoing infall in this source (Jørgensen et al. 2012; Pineda et al. 2012). Integrating over a larger velocity interval reveals, in addition to the absorption, a blue-shifted emission peak, offset  south of the absorption (see Figs. 1 and 2).
4.2. Temperature and deuteration of water vapor
To calculate the excitation temperature and column densities toward source A we assume LTE conditions and that the emission at 203 and 225 GHz has the same extent as in the 692 GHz observations (see Table 1). Scaling the 203 GHz H218O intensities to the 692 GHz source size gives an excitation temperature of Tex = 124 ± 12 K for H218O. If the 692 GHz line is indeed blended, it would imply that the intensity estimate, and also the excitation temperature, are upper limits. Halving the intensity of the 692 GHz line causes a drop to Tex = 107 ± 9 K. The extent and peak location of the emission in source A show that the warm water vapor is located at a small projected distance from the center of the protostar. The determined excitation temperature indicates that the distance is also small along the line of sight.
The estimated HDO column density is 4.8 × 1017 cm-2, corrected for beam dilution when assuming that the extent of the emission is that of the 692 GHz H218O observations and Tex = 124 K. The gas-phase H2O column density is 5.3 × 1020 cm-2 assuming the same as for HDO and that the isotopic abundance ratio of 16O/18O is 560 in the local interstellar medium (Wilson & Rood 1994). Assuming an uncertainty of about 20% for the column densities, originating in the flux calibration, the best estimate of the HDO/H2O ratio is (9.2 ± 2.6) × 10-4.
Given the uncertainty in the determination of the excitation temperature, testing the effect of different temperatures is important. If the excitation temperature is as low as 80 K the HDO/H2O ratio becomes 7.8 ± 2.2 × 10⁻⁴. Increasing the excitation temperature to 300 K (Jørgensen et al. 2012) increases the ratio to 1.1 ± 0.3 × 10⁻³. The conclusions in this paper do not change over this wide interval in Tex. In addition, since the 203 GHz H218O and 225 GHz HDO observations have comparable beam and sources size, and arise from levels with similar energies, the deduced HDO/H2O ratio is robust. However, if the HDO emission were more extended, its column density and the HDO/H2O ratio would be lower. In this scenario our inferred ratio is an upper limit.
In contrast with previous estimates based on models of single-dish observations (Parise et al. 2005; Coutens et al. 2012), the deduced HDO/H2O ratio in the warm gas of IRAS 16293-2422 is only slightly higher than found in Earth’s oceans and by recent Herschel observations of comets. Given the possible systematic errors due to assumptions of the extent, they could be even closer. Within the statistical uncertainties our observed ratio for this protostar agrees with the earlier ratios for Oort cloud comets. Comparing these different ratios for water directly assumes that the reservoirs, i.e., comets, Earth (planet) and inner protostellar region are linked and can be related.
The difference with the earlier estimates comes from the fact that those data are sensitive to much larger scales than the high-resolution interferometric observations presented here, which directly image the water emission on 25 − 280 AU scales. Our interferometric observations provide a strong, model independent constraint on the deuteration of water in the innermost regions of protostars. That the low HDO/H2O ratio in the warm gas is not much different from the cometary values is an indication that significant processing of the water between these early stages and the emerging solar system is not required.
Further high-resolution interferometric measurements toward larger samples of protostars will reveal whether the warm HDO/H2O ratio is similar in different protostars. In particular, future high angular resolution observations with ALMA will be able to resolve possible variations in the HDO/H2O ratio with distance from the central protostar and thereby show whether the slightly different ratios measured in different types of comets potentially could be related to their spatial origin in the protostellar envelope (Robert et al. 2000).
Online material
Appendix A
Relevant parameters from the molecular line catalogs for the observed lines.
Acknowledgments
We thank the referee, Al Wootten, for insightful comments. The research at Centre for Star and Planet Formation is supported by the Danish National Research Foundation and the University of Copenhagen’s programme of excellence. This research was furthermore supported by a Junior Group Leader Fellowship from the Lundbeck Foundation to JKJ. E.v.D. acknowledges the Netherlands Organization for Scientific Research (NWO) grant 614.001.008 and EU FP7 grant 291141 CHEMPLAN. This paper makes use of the following ALMA data: ADS/JAO.ALMA#2011.0.00007.SV. The authors are grateful to JAO CSV team for planning and executing the ALMA data, and to Tim van Kempen and Markus Schmalzl of the Allegro node for help with data reduction. ALMA is a partnership of ESO (representing its member states), NSF (USA) and NINS (Japan), together with NRC (Canada) and NSC and ASIAA (Taiwan), in cooperation with the Republic of Chile. The Joint ALMA Observatory is operated by ESO, AUI/NRAO and NAOJ. The Submillimeter Array is a joint project between the Smithsonian Astrophysical Observatory and the Academia Sinica Institute of Astronomy and Astrophysics and is funded by the Smithsonian Institution and the Academia Sinica.
References
- Alves, F. O., Vlemmings, W. H. T., Girart, J. M., & Torrelles, J. M. 2012, A&A, 542, A14 [NASA ADS] [CrossRef] [EDP Sciences] [Google Scholar]
- Bisschop, S. E., Jørgensen, J. K., Bourke, T. L., Bottinelli, S., & van Dishoeck, E. F. 2008, A&A, 488, 959 [NASA ADS] [CrossRef] [EDP Sciences] [Google Scholar]
- Blake, G. A., van Dishoeck, E. F., Jansen, D. J., Groesbeck, T. D., & Mundy, L. G. 1994, ApJ, 428, 680 [NASA ADS] [CrossRef] [Google Scholar]
- Bockelée-Morvan, D., Biver, N., Swinyard, B., et al. 2012, A&A, 544, L15 [NASA ADS] [CrossRef] [EDP Sciences] [Google Scholar]
- Bottinelli, S., Ceccarelli, C., Neri, R., et al. 2004, ApJ, 617, L69 [NASA ADS] [CrossRef] [Google Scholar]
- Caux, E., Kahane, C., Castets, A., et al. 2011, A&A, 532, A23 [NASA ADS] [CrossRef] [EDP Sciences] [Google Scholar]
- Cazaux, S., Tielens, A. G. G. M., Ceccarelli, C., et al. 2003, ApJ, 593, L51 [NASA ADS] [CrossRef] [Google Scholar]
- Chandler, C. J., Brogan, C. L., Shirley, Y. L., & Loinard, L. 2005, ApJ, 632, 371 [NASA ADS] [CrossRef] [Google Scholar]
- Chiang, H.-F., Looney, L. W., & Tobin, J. J. 2012, ApJ, 756, 168 [NASA ADS] [CrossRef] [Google Scholar]
- Coutens, A., Vastel, C., Caux, E., et al. 2012, A&A, 539, A132 [NASA ADS] [CrossRef] [EDP Sciences] [Google Scholar]
- Geiss, J., & Gloeckler, G. 1998, Space Sci. Rev., 84, 239 [NASA ADS] [CrossRef] [Google Scholar]
- Hartogh, P., Lis, D. C., Bockelée-Morvan, D., et al. 2011, Nature, 478, 218 [NASA ADS] [CrossRef] [PubMed] [Google Scholar]
- Jørgensen, J. K., & van Dishoeck, E. F. 2010, ApJ, 710, L72 [NASA ADS] [CrossRef] [Google Scholar]
- Jørgensen, J. K., Bourke, T. L., Myers, P. C., et al. 2005, ApJ, 632, 973 [NASA ADS] [CrossRef] [Google Scholar]
- Jørgensen, J. K., Bourke, T. L., Nguyen Luong, Q., & Takakuwa, S. 2011, A&A, 534, A100 [NASA ADS] [CrossRef] [EDP Sciences] [Google Scholar]
- Jørgensen, J. K., Favre, C., Bisschop, S. E., et al. 2012, ApJ, 757, L4 [NASA ADS] [CrossRef] [Google Scholar]
- Knude, J., & Høg, E. 1998, A&A, 338, 897 [NASA ADS] [Google Scholar]
- Kuan, Y.-J., Huang, H.-C., Charnley, S. B., et al. 2004, ApJ, 616, L27 [NASA ADS] [CrossRef] [Google Scholar]
- Lécuyer, C., Gillet, P., & Robert, F. 1998, Chem. Geol., 145, 249 [NASA ADS] [CrossRef] [Google Scholar]
- Linsky, J. L. 2003, Space Sci. Rev., 106, 49 [NASA ADS] [CrossRef] [Google Scholar]
- Liu, F.-C., Parise, B., Kristensen, L., et al. 2011, A&A, 527, A19 [NASA ADS] [CrossRef] [EDP Sciences] [Google Scholar]
- Loinard, L., Torres, R. M., Mioduszewski, A. J., & Rodríguez, L. F. 2008, ApJ, 675, L29 [NASA ADS] [CrossRef] [Google Scholar]
- Loinard, L., Zapata, L. A., Rodriguez, L. F., et al. 2012, MNRAS, in press [arXiv:1211.4744] [Google Scholar]
- McMullin, J. P., Waters, B., Schiebel, D., Young, W., & Golap, K. 2007, in Astronomical Data Analysis Software and Systems XVI, eds. R. A. Shaw, F. Hill, & D. J. Bell, ASP Conf. Ser., 376, 127 [Google Scholar]
- Müller, H. S. P., Thorwirth, S., Roth, D. A., & Winnewisser, G. 2001, A&A, 370, L49 [NASA ADS] [CrossRef] [EDP Sciences] [Google Scholar]
- Parise, B., Simon, T., Caux, E., et al. 2003, A&A, 410, 897 [NASA ADS] [CrossRef] [EDP Sciences] [Google Scholar]
- Parise, B., Caux, E., Castets, A., et al. 2005, A&A, 431, 547 [NASA ADS] [CrossRef] [EDP Sciences] [Google Scholar]
- Persson, M. V., Jørgensen, J. K., & van Dishoeck, E. F. 2012, A&A, 541, A39 [NASA ADS] [CrossRef] [EDP Sciences] [Google Scholar]
- Pickett, H. M., Poynter, R. L., Cohen, E. A., et al. 1998, J. Quant. Spectrosc. Radiat. Trans., 60, 883 [Google Scholar]
- Pineda, J. E., Maury, A. J., Fuller, G. A., et al. 2012, A&A, 544, L7 [NASA ADS] [CrossRef] [EDP Sciences] [Google Scholar]
- Qi, C. 2008, The MIR Cookbook, The Submillimeter Array, Harvard-Smithsonian Center http://cfa-www.harvard.edu/~{}cqi/mircook.html [Google Scholar]
- Robert, F., Gautier, D., & Dubrulle, B. 2000, Space Sci. Rev., 92, 201 [NASA ADS] [CrossRef] [Google Scholar]
- Sault, R. J., Teuben, P. J., & Wright, M. C. H. 1995, in Astronomical Data Analysis Software and Systems IV, eds. R. A. Shaw, H. E. Payne, & J. J. E. Hayes, ASP Conf. Ser., 77, 433 [Google Scholar]
- Stark, R., Sandell, G., Beck, S. C., et al. 2004, ApJ, 608, 341 [NASA ADS] [CrossRef] [Google Scholar]
- van Dishoeck, E. F., Blake, G. A., Jansen, D. J., & Groesbeck, T. D. 1995, ApJ, 447, 760 [NASA ADS] [CrossRef] [Google Scholar]
- Villanueva, G. L., Mumma, M. J., Bonev, B. P., et al. 2009, ApJ, 690, L5 [NASA ADS] [CrossRef] [Google Scholar]
- Wilson, T. L., & Rood, R. 1994, ARA&A, 32, 191 [NASA ADS] [CrossRef] [Google Scholar]
All Tables
Parameters from fits to the integrated maps and spectra of the different water lines for source A and B.
All Figures
|
Fig. 1 Spectra of the targeted water lines toward both IRAS 16293-2422 A and B. The 203 GHz H218O line spectrum (top) was binned to twice the resolution for clarity. The 1D Gaussian fits (red: H218O; green: CH3OCH3; magenta: unidentified) and the RMS (blue) are plotted. Shaded areas show the interval over which the integrated intensities have been calculated (yellow and blue). The dotted green vertical lines shows vLSR = 3.2 and 2.7 km s-1 for source A and B respectively. The third spectrum from the top (blue fill) is from data smoothed with a 1′′ Gaussian kernel. |
| In the text | |
|
Fig. 2 Integrated intensity maps for all observed water lines calculated from channels ± 3 from the systemic velocity, deduced from previous observations (Jørgensen et al. 2011). The absorption line toward source B was integrated in the interval 0−5 km s-1. Note the different spatial scales of the top vs the bottom panels. The beam is shown in the lower right corner and the gray crosses show the position of continuum peaks from elliptical Gaussian fits. Units on the axes are offset in arcseconds from the phase center of the 203 GHz observations. Contours are in steps of 2σ starting at 3σ, dashed contours represent negative values. |
| In the text | |
Current usage metrics show cumulative count of Article Views (full-text article views including HTML views, PDF and ePub downloads, according to the available data) and Abstracts Views on Vision4Press platform.
Data correspond to usage on the plateform after 2015. The current usage metrics is available 48-96 hours after online publication and is updated daily on week days.
Initial download of the metrics may take a while.