Fig. 2
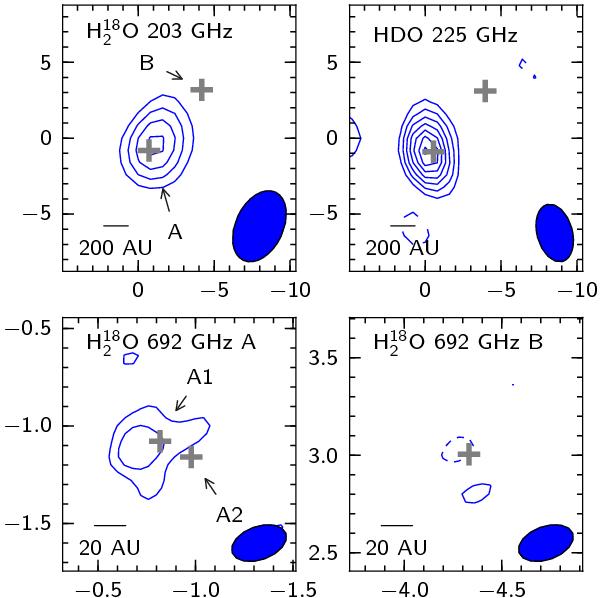
Integrated intensity maps for all observed water lines calculated from channels ± 3 from the systemic velocity, deduced from previous observations (Jørgensen et al. 2011). The absorption line toward source B was integrated in the interval 0−5 km s-1. Note the different spatial scales of the top vs the bottom panels. The beam is shown in the lower right corner and the gray crosses show the position of continuum peaks from elliptical Gaussian fits. Units on the axes are offset in arcseconds from the phase center of the 203 GHz observations. Contours are in steps of 2σ starting at 3σ, dashed contours represent negative values.
Current usage metrics show cumulative count of Article Views (full-text article views including HTML views, PDF and ePub downloads, according to the available data) and Abstracts Views on Vision4Press platform.
Data correspond to usage on the plateform after 2015. The current usage metrics is available 48-96 hours after online publication and is updated daily on week days.
Initial download of the metrics may take a while.