Fig. 1
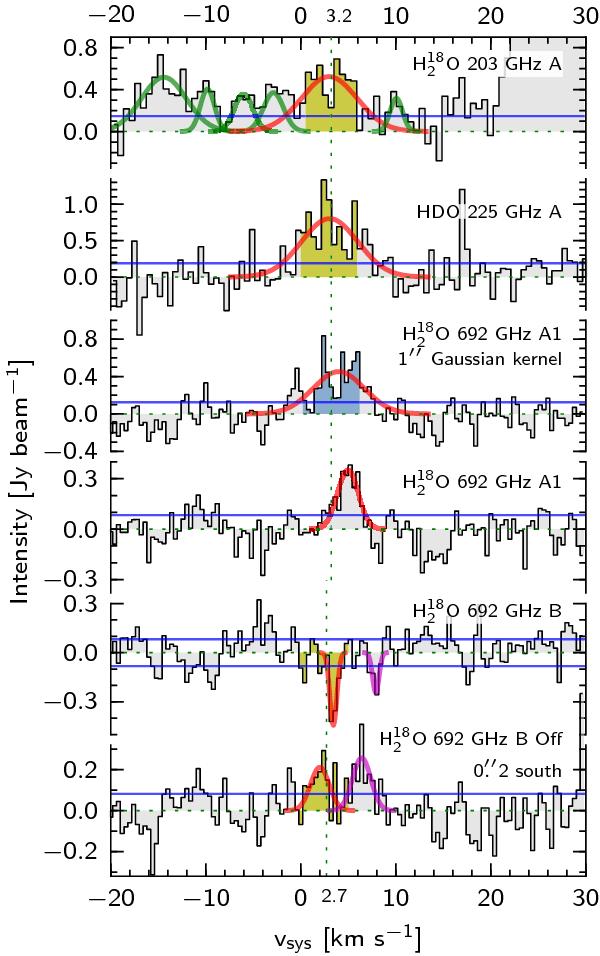
Spectra of the targeted water lines toward both IRAS 16293-2422 A and B. The 203 GHz H218O line spectrum (top) was binned to twice the resolution for clarity. The 1D Gaussian fits (red: H218O; green: CH3OCH3; magenta: unidentified) and the RMS (blue) are plotted. Shaded areas show the interval over which the integrated intensities have been calculated (yellow and blue). The dotted green vertical lines shows vLSR = 3.2 and 2.7 km s-1 for source A and B respectively. The third spectrum from the top (blue fill) is from data smoothed with a 1′′ Gaussian kernel.
Current usage metrics show cumulative count of Article Views (full-text article views including HTML views, PDF and ePub downloads, according to the available data) and Abstracts Views on Vision4Press platform.
Data correspond to usage on the plateform after 2015. The current usage metrics is available 48-96 hours after online publication and is updated daily on week days.
Initial download of the metrics may take a while.