| Issue |
A&A
Volume 549, January 2013
|
|
|---|---|---|
| Article Number | A92 | |
| Number of page(s) | 31 | |
| Section | Interstellar and circumstellar matter | |
| DOI | https://doi.org/10.1051/0004-6361/201220298 | |
| Published online | 03 January 2013 | |
A sensitive survey for 13CO, CN, H2CO, and SO in the disks of T Tauri and Herbig Ae stars⋆,⋆⋆
1
Univ. Bordeaux, LAB, UMR 5804, 33270
Floirac,
France
2
CNRS, LAB, UMR 5804, 33270
Floirac,
France
e-mail: guilloteau@obs.u-bordeaux1.fr; difolco@obs.u-bordeaux1.fr; dutrey@obs.u-bordeaux1.fr
3
Department of Physics and Astronomy, Stony Brook
University, Stony
Brook, NY
11794-3800,
USA
4
Observatoire Astronomique de Strasbourg, Université de Strasbourg,
CNRS, UMR 7550, 11 rue de l’Université, 67000
Strasbourg,
France
5
IRAM, 300 rue de la piscine, 38406 Saint Martin
d’Hères,
France
Received: 28 August 2012
Accepted: 8 November 2012
Aims. We investigate the suitability of several molecular tracers, in particular CN N = 2−1 line emission, as a confusion-free probe of the kinematics of circumstellar disks.
Methods. We use the IRAM 30-m telescope to perform a sensitive search for CN N = 2−1 in 42 T Tauri or Herbig Ae systems located principally in the Taurus-Auriga region. 13CO J = 2−1 is observed simultaneously to provide an indication of the level of confusion with the surrounding molecular cloud. The bandpass also contains two transitions of ortho-H2CO, one of SO and the C17O J = 2−1 line which provide complementary information on the nature of the emission.
Results. While 13CO is in general dominated by residual emission from the cloud, CN exhibits a high disk detection rate >50% in our sample. We even report CN detection in stars for which interferometric searches failed to detect 12CO, presumably because of obscuration by a foreground, optically thick, cloud. Comparison between CN and o-H2CO or SO line profiles and intensities divide the sample in two main categories. Sources with SO emission are bright and have strong H2CO emission, leading in general to [H2CO/CN] > 0.5. Furthermore, their line profiles, combined with a priori information on the objects, suggest that the emission is coming from outflows or envelopes rather than from a circumstellar disk. On the other hand, most sources have [H2CO/CN] < 0.3, no SO emission, and some of them exhibit clear double-peaked profiles characteristics of rotating disks. In this second category, CN is likely tracing the proto-planetary disks. From the line flux and opacity derived from the hyperfine ratios, we constrain the outer radii of the disks, which range from 300 to 600 AU. The overall gas disk detection rate (including all molecular tracers) is ~ 68%, and decreases for fainter continuum sources.
Conclusions. The current study demonstrates that gas disks, like dust disks, are ubiquitous around young PMS stars in regions of isolated star formation, and that a large fraction of them have Rout ≳ 300 AU. It also shows the potential of the CN N = 2−1 transition to probe the kinematics of these disks, thereby measuring the stellar mass, using high resolution observations with ALMA.
Key words: radio lines: planetary systems / stars: pre-main sequence / circumstellar matter / protoplanetary disks
Based on observations carried out with the IRAM 30-m telescope. IRAM is supported by INSU/CNRS (France), MPG (Germany) and IGN (Spain).
Appendices are available in electronic form at http://www.aanda.org
© ESO, 2013
1. Introduction
Masses of young stars are a fundamental property with impacts on theories of the stars’ formation, calculations of their evolution to the main sequence, and the chronology of the planets that may be, or will be, associated with them. Dynamical techniques provide the only absolutely reliable measurements of mass. Because most binary orbits are at least a few years long, the quickest way to accomplish a dynamical measurement is by mapping the Keplerian rotation of the circumstellar disk of a young star (Guilloteau & Dutrey 1998; Simon et al. 2000). These early studies, and especially the more recent observations by Schaefer et al. (2009), were all carried out by mm-wave interferometry in the J = 1−0 and J = 2−1 transitions of 12CO and revealed two limitations of the method. The first is intrinsic: Young stars with disks are generally located in molecular clouds whose optically thick 12CO emission may mask the disk emission of the star. The second limitation was technical: it was difficult to find young stars with masses smaller than 0.5 M⊙ that have detectable gaseous circumstellar disks. A possible solution to the first problem could be observation in the lines of 13CO or C18O because the optical depth of the molecular cloud would be less in these transitions than in 12CO. However, the disk emission in the lines of the CO isotopologues would of course be less than that of the 12CO lines. We judged that, at the time of our observations, the instrumentation available to us had insufficient sensitivity to obtain mass measurements to the required precision, ≤ 5%. The commissioning of the Atacama Large Millimeter/Submillimeter Array (ALMA) offers the promise to remove both obstacles to mass measurement of young low mass stars by mapping the rotation of their disks.
Our goal in this work is to assess the applicability of several molecular tracers for confusion-free and high sensitivity measurements of disk kinematics using ALMA. After 12CO, the strongest lines in disks are the rotational transitions of 13CO J = 2−1 or 3−2, HCO+J = 3−2 and the hyperfine split lines of CN N = 2−1 (Dutrey et al. 1997; Öberg et al. 2010). However, 13CO line emission can also be affected by confusion (e.g. Dutrey et al. 2003, for BP Tau). The situation is less clear for HCO+J = 3−2, but this transition can still have substantial optical depth and be excited in clouds (see for example CW Tau in Salter et al. 2011); furthermore, its relatively high frequency requires better observing conditions. Other previous searches for molecular tracers in disks were conducted with the single-dishes (principally the IRAM 30-m and JCMT) or mm/sub-mm arrays (IRAM PdBI, SMA and CARMA). The former were limited in sensitivity (e.g. Salter et al. 2011, for a study of CN N = 2−1 and HCO+J = 3−2), while, because of the need for sufficient UV coverage, the latter could only observe a few stars (e.g. Öberg et al. 2010).
Recent advances in receiver and back-end technology at the IRAM 30-m telescope encouraged us to carry out a new assessment of molecular line tracers in circumstellar disks, particularly the CN N = 2−1 line hyperfine split lines. We report here our systematic search for CN N = 2−1 emission in 40 young stars located in the Taurus/Auriga star forming region (SFR). Together with previous observations, 46 stars in this SFR have now been observed with high sensitivity in this transition, a gain of a factor almost four in sample size. Section 2 describes our sample, the observations, and their analysis. Section 3 presents our results for the CO isotopologues, CN, H2CO, and SO molecules. Section 4 discusses our assessment of CN as a disk tracer and comments on stars with outflows and on general properties of the observed line emission. Section 5 summarizes our results. An Appendix shows all the observed spectra and provides details for many of the stars.
Source sample.
2. Observations and data analysis
2.1. Source sample
We focus here principally on the Taurus Aurigae region, to which we add CB26, an embedded source in an isolated Bok globule, and HD 163296, an isolated HAe star. Our study is thus only relevant to regions of isolated star formation. Table 1 lists the stars involved in this study; the 40 stars observed anew at the IRAM 30-m radiotelescope appear without specific symbols. This sub-sample was observed in an homogeneous way. It is completed by observations on a few sources (marked by specific symbols in the Table) obtained independently, also with the IRAM 30-m. 13CO, CN and the ortho-H2CO 313 − 212 transitions were observed towards the Herbig Ae star HD 163296, together with the SO 65 − 54 line. Data from DM Tau is from Dutrey et al. (1997). The intensity reported for LkCa 15 is from a noisy IRAM 30-m spectrum, but is consistent with the interferometric data of Chapillon et al. (2012). CI Tau, CY Tau and GO Tau were detected with the IRAM 30-m, and later imaged at the IRAM Plateau de Bure array (Guilloteau et al., in prep.). The overall sample covers a wide range of spectral types (from M5.5 to A0, taken from Luhman et al. 2010), luminosities (0.2 to 45 L⊙), and 1.3 mm continuum flux densities (from <4 to ~800 mJy), but is not complete with respect to these quantities. No specific account about extinction and location with respect to molecular clouds was made when selecting sources. Sources with outflows were deliberately included. The epoch 2000 coordinates are from interferometric mm continuum images (Guilloteau et al. 2011) when available, or SIMBAD otherwise.
2.2. Observations
Most observations were carried out with the IRAM 30-m telescope from Dec. 4 to Dec. 8 2011, under excellent weather conditions (precipitable water vapor content below 1 mm). A few additional sources were observed on the afternoon of May 1st, 2012 using the same instrumental setup. The weather was good (water vapor content about 3 mm), but a few clouds occasionally produced anomalous refraction. The absolute calibration of this second set is thus more uncertain.
The dual-polarization, sideband separating receivers were tuned to cover approximately 7.8 GHz of bandwidth around 224.3 GHz in the upper sideband (USB) and 208.7 GHz in the lower sideband (LSB). The 8 units of the FTS back-end (each of them being made of 3 adjacent sub-units) covered more precisely 4 frequency ranges (with 2 polarization each) at [220.325, 224.365] and [224.055, 228.105] GHz in USB, and [204.655, 208.695] and [208.375, 212.425] GHz in LSB. The back-end provides a spectral resolution of 195 kHz, which translates into 0.25−0.28 km s-1 in this frequency range. The spectral setup includes several lines (listed in Table 2) which can be relevant for disks, in particular all 19 hyperfine components of CN N = 2−1. The sideband separating mixers provide a mean rejection around 13 dB. However, the presence of strong lines spread over the band indicate some variation across the band. A fortunate case is the SO (54−43) transition at 206.176062 GHz, which appears at 226.572 GHz in the image sideband and permits a control of the rejection near the CN N = 2−1 lines, whose strongest hyperfine components are at 226.874 and 226.657 GHz. Single sideband system temperatures were in the range 170−190 K in December, and 170−250 K in May.
In December 2011, the exceptionally dry weather and clear sky produced rapid cooling a few hours after sunset, which could not be compensated by the thermal regulation of the telescope, and resulted in significant pointing changes. This also presumably affected the telescope efficiency. In May, anomalous refraction clearly occurred occasionally. As a result, the absolute calibration is in general accurate to 10−15% but on several sources is not better more than about 25%. However, since we control the receiver sideband rejection, the relative intensities of the detected lines are expected to be accurate to within 5% or better, noise being in general a more severe limitation. Given the absolute calibration issues, we did not correct for the elevation dependent antenna gain, and simply use a uniform conversion factor from antenna temperature ( ) to flux density of 9 Jy/K.
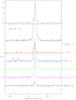 |
Fig. 1 Spectra of the observed transitions towards Haro 6-10. Top panel: 13CO J = 2−1 spectrum. Bottom panels, from top to bottom: spectra of 13CO J = 2−1, C17O J = 2−1, CN N = 2−1, ortho H2CO 313 − 212, ortho H2CO 312 − 211, and SO 54 − 43 presented on a common scale. The Y axis scale is antenna temperature, |
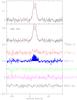 |
Fig. 2 As Fig. 1 but towards MWC 480. The red curve is a simple Gaussian fit to the disk emission in 13CO J = 2−1. |
Since our targets should be unresolved by the IRAM 30-m, the observations were performed in symmetric wobbler switching mode, with the two references ±60′′ away at the same elevation. Together with the stable weather in December, this mode provided flat baselines, allowing clear detection of the continuum emission from the dust in most sources. Occasional baseline discontinuities between the 3 sub-units (“platforming”) were visible in the spectra, but none of the spectral lines we searched for were affected by this problem.
We observed the sample of 40 sources (see Table 1), for about 1 h each. For a typical linewidth of 2.6 km s-1 (2 MHz), representative of our sources, this gives a detection sensitivity of 0.08 Jy km s-1 (1σ) on the integrated line flux.
Frequencies of transitions.
2.3. Data analysis
We removed linear baselines in a window ±60 km s-1 wide around each spectral line. Spectra for all objects appear in Appendix B. Figures 1 and 2 show spectra for two objects: Haro 6−10 which exhibits bright lines in all molecules, and MWC 480, an isolated HAe star for which CN has already been imaged with the IRAM array (Chapillon et al. 2012), included in our sample as a reference object. To derive line intensities, we fitted simple Gaussian profiles to the observed lines taking into account the hyperfine structure of the C17O J = 2−1 and CN N = 2−1 lines. We used the “HFS (hyperfine structure)” method of the CLASS data analysis program in the GILDAS1 package for this purpose. This method assumes a common excitation temperature for all the hyperfine components, a likely situation at the high densities appearing in disks. For a Gaussian line, the emerging profile is then  (1)where Ri are the relative intensities (ΣiRi = 1), vi the velocity of each hyperfine component with respect to a common reference frequency, and τ the total line opacity (sum over all hyperfine components, as the Ri are normalized). Vsys is the source velocity, δV the line width at 1/e, and η a beam filling factor. The HFS method uses X = ητ(Jν(Tex) − Jν(Tbg), Vsys, δV and τ as free parameters. The difference in saturation between the various hyperfine components allows determination of τ provided sufficient signal to noise. For CN, although all 19 hyperfine transitions were used for the fitting, the quoted integrated line flux includes only the 3 blended hyperfine components around 226.874 GHz and the two weak components at 226 887.399 & 226 892.151 MHz (which appear near VLSR − 11 and −17 km s-1 in the brighter sources)2. Given the line ratios, the total line flux including all hyperfine components would be 1.67 times larger in the optically thin limit.
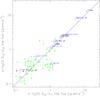 |
Fig. 3 Integrated line flux of the 312 − 211 line of H2CO vs that of the 313 − 212 transition. Color codes indicate detected vs. non-detected lines: blue for detection of both lines, black for detection of the 313 − 212 line, green for non detections. The detection threshold is set at 4σ. For detected lines, the errorbars are 1σ. For non-detected lines, the limit is the 2σ value, and the arrow length is 1σ. Sources in italics are those with known molecular outflows. |
The two transitions of ortho-H2CO exhibit a strong correlation (see Fig. 3) because they arise in the same rotational levels and differ only by the small K splitting, with the 211.2 GHz line on average 20% stronger than the 225.2 GHz line. We therefore computed an average spectrum and line intensity using this ratio. For the several lines we analyzed, Tables 3 and 4 list the derived line intensity, VLSR and line width, ΔV. Figures 4 through 7 display relationships of the line intensities. The color coding in these plots is as follows: blue designates detection of both lines, red designates detection only of the line plotted on the x-axis, and black detection only of the line plotted along the y-axis, and green is for non detection of both lines. Sources in italics are those with known molecular outflows.
Fit results: CN and 13CO.
Fit results: H2CO and C17O.
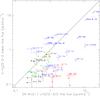 |
Fig. 4 Integrated line flux of H2CO (combination of both transitions) vs. CN N = 2−1 (main group of hyperfine components). Color codes indicate detected vs. non-detected lines: blue for detection of both lines, red for detection of the x-axis line only (here CN), black for detection of the y-axis line only (here H2CO), and green for non detections. The detection threshold is set at 3σ. For detected lines, the errorbars are 1σ. For non-detected lines, the limit is the 2σ value (best fit + 2σ), and the arrow length is 1σ. Sources in italics are those with known molecular outflows. |
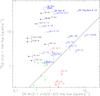 |
Fig. 5 As for Fig. 4 but for 13CO J = 2−1 (including contribution from the cloud) vs. CN N = 2−1. T Tau is out of scale here. |
The 13CO results are seriously affected by confusion. In many cases, we attempted to fit only a putative disk component, by masking the channels in which confusion seemed likely, either because they appear negative or exceedingly strong, or because of strong C17O emission at the same velocity. A summary of disk detection is given in Table 5. The fits are displayed on top of the 13CO spectra in the figures of Appendix B. The fit results can be found in Table 3. These derived line intensities are presented as a function of CN line flux in Fig. 9. Because of the masking process to ignore confused parts of the spectrum, the errorbars can be large. However, in sources where both 13CO and CN are detected, they in general display similar intensities, within a factor 2.
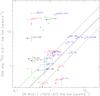 |
Fig. 9 As for Fig. 4 but for 13CO (disk component only) vs. CN. The dashed lines indicate a factor 2 between the two line fluxes. |
3. Results
Line emission from these objects can come a priori from 4 distinct regions: molecular cloud(s) along the line of sight, the circumstellar disk, a molecular outflow and (specially for the youngest objects) a remnant envelope. Molecular cloud will exhibit narrow lines, and because of our observing technique which differentiate the emission with that 1′ away, may appear in emission or absorption. Disks should lead to symmetric, in general double-peaked, line profiles, and line widths ∝ sini (with typical values 2−4 km s-1, face-on objects being rare). Contribution from outflows or envelopes may vary considerably, and may be difficult to distinguish from disk emission. Most of the stars in Table 1 have a rich observational history from optical, infrared and radio molecular line observations which can help interpreting the line profiles. We have compiled the relevant information and comment on the observational results for each source in Appendix A.
3.1. Confusion in 13CO
The 13CO spectra are in general complex. Out of the 42 sources, the only two in which 13CO exhibits the expected double-peaked profile which is a clear signature of emission from Keplerian disk are the previously studied objects GG Tau and MWC 480 (see Fig. 2), included here as reference objects. CQ Tau and MWC 758 also exhibit 13CO spectra which can be attributed solely to disk emission. These 4 sources had been previously studied specifically because they are relatively far from the molecular clouds.
For the other sources, the spectrum complexity has two main origins. Narrow features appear in emission or apparent absorption. These narrow features result from small velocity and intensity gradients in the molecular cloud which are on the same line of sight. Our beam-switching observing procedure reveals such gradients on the arcminute scale. Note that, as the switching was made at constant elevation, the gradient direction rotates on the plane of the sky, so that the observed features actually depend on when the observations were performed. A comparison between the spectra of BP Tau obtained here and that published by Dutrey et al. (2003) illustrates this effect. The BP Tau case also demonstrates that the lack of apparent confusion does not imply the source is unaffected by the cloud: a sufficiently optically thick and homogeneous cloud will hide any disk emission situated behind.
CN outer radii and line detections.
Besides contamination by molecular clouds, many sources also exhibit strong, relatively wide profiles in 13CO. Based on prior knowledge about these sources, this emission is in general coming from outflows or envelopes, as in HL Tau, T Tau, Haro 6-10, CB26, DG Tau and DG Tau B, which are all known to drive powerful jets and CO outflows (see Appendix A). This interpretation is corroborated by the emission lines from other molecules (see below). However, the line widths are not very large, so this emission can also contain a substantial contribution from the disk, specially for edge-on disks. An example is IRAS 04302+2247 (hereafter 04302+2247, the Butterfly star, see Wolf et al. 2003), for which IRAM interferometric observations reveal that the detected lines clearly trace the disk (Dutrey et al., in prep.).
Despite confusion with molecular clouds, many other sources exhibit line wings which are potential signatures of disk emission. As mentioned in Sect. 2.3, these sources are identified in Table 5, and appear in Fig. 9.
3.2. CN as a confusion-free disk tracer
There is essentially no evidence for confusion with molecular clouds in CN, except for a few (4 or 5) sources. This can be seen by the lack of narrow features corresponding to those detected in 13CO.
Only two sources exhibit clear evidence of confusion in CN: CW Tau and CIDA-1 (see Figs. B.2 and B.3) in which the CN lines appear in absorption. These two sources are separated by a few arcmin only, and all other lines also display the same behaviour, clearly demonstrating the confusion along this line of sight. The lines are very narrow, 0.44 ± 0.04 km s-1, a further indication that this comes from a cold molecular cloud. More detailed arguments about the properties of the molecular cloud and its impact as a confusing signal for disk emission are given in Appendix C.
A closer examination reveals confusion in two other sources, AA Tau and AB Aur, and an unclear situation for Haro 6-13, which exhibit emission with relatively narrow lines (see Table 3 and Appendix A for details). Finally, like for 13CO, a lack of apparent confusion does not indicate an absence of confusion.
CN emission is compatible with optically thin emission in most sources (τp < 0.5, where τp is the peak line opacity). The HFS method yields τ, the sum of opacities of all hyperfine components. The main group of components accounts for a little more than half of this sum, but with local linewidths in the range 0.2−0.5 km s-1, the peak opacity is τp ~ 0.27−0.4τ, because the hyperfine components overlap only very moderately, being separated by 0.77 and 1.50 km s-1. The opacity is constrained in the brightest sources: T Tau has optically thin emission (τ = 0.53 ± 0.06) but Haro 6-10 exhibits substantial optical depth (τ = 3.0 ± 0.3, i.e. τp ≈ 1). The next brightest source, DG Tau, is marginally thick (τ = 0.9 ± 0.3). The spectra also suggest CN could be optically thick in the Butterfly star 04302+2247, but because of limited signal-to-noise ratio, the significance is low (τ = 10 ± 3). Spectra of these sources are displayed in Fig. 10, together with the best fit profiles.
Non zero optical depth (τ ≃ 1) is also suggested for some of the other strong sources, such has DL Tau, and also DM Tau and LkCa 15, but the error bars remain large. The interferometric study performed by Chapillon et al. (2012) however confirms that CN is not completely optically thin in the latter two sources. Apart from Haro 6-10 and 04302+2247, we found no other source in our sample with optical depth larger than ~1; the weighted mean opacity is ~0.63.
In summary, we detected CN N = 2−1 in 24 out of the 42 stars in our sample, and have only 4 cases of confusion, and essentially all spectra are consistent with total optical depth ~0.3−0.6.
3.3. SO and H2CO as outflow or envelope tracers
Strong SO emission is found in 7 out of the 41 stars in which it has been observed (see Fig. 6). All these sources also display relatively strong H2CO emission (see Fig. 7). All of them, except 04302+2247, are driving well-known jets and outflows. In these sources, CN is either quite strong (DG Tau, T Tau, DG Tau B, Haro 6-10) or very weak (CB26, HL Tau). All these sources are also deeply embedded, and surrounded by an extended complex envelope. We also have a marginal detection of SO in Haro 6-5 B, another embedded, jet-driving object. The line profiles of SO and H2CO are similar, and resemble those of C17O when detected. As the line widths are not very wide, this emission may be attributed to the envelope rather than the outflow itself. On the contrary, CN lines often display profiles which are quite different from those of SO, being either narrower (e.g. HL Tau, Fig. B.16) or with no narrow velocity component (DG Tau B, Fig. B.10), or (rarely) broader (DG Tau, see Fig. B.11).
The detection rate of H2CO is rather high, with 20 out of 42 stars observed (not counting the dubious cases FN Tau and CIDA-8). However, cloud contamination appears more important in H2CO (7 sources with narrow lines out of 42) than in CN. This can be explained by excitation considerations, because of the smaller critical densities of the observed transitions of H2CO compared to CN N = 2−1. These transitions have similar Einstein coefficients, but the collisional rates of H2CO with para-H2 (Troscompt et al. 2009) are typically 5 to 10 times larger than those of CN with para-H2 at 10 K (Kalugina et al. 2012). On average, CN is brighter than H2CO (see Fig. 4), and the high detection rate of H2CO is obtained because two lines of similar intensities could be observed simultaneously and added in this study. Strong H2CO lines clearly correlates with SO detectability (see Fig. 7), i.e. in general outflow-driving sources.
3.4. C17O and other lines
While 13CO emission from disk is overwhelmed by confusion, C17O is in general too faint to be a suitable tracer of disks (only 9 detections out of 40 observed sources, see Fig. 8). It is convincingly detected in the disks of AB Aur, MWC 480 and 04302+2227 only. On another hand, residual confusion from the cloud is still visible in many sources: CW Tau and CIDA-1, CIDA-8, Haro 6-13, HK Tau, Haro 6-33, Haro 6-5 B, HH 30, and LkHa 358. The strong emission from HL Tau and CB26 presumably comes from their outflows, as the lineshapes are complex and resemble those of SO. For other “outflow” sources, the linewidths are small enough to leave some doubt about the origin.
We also have a 5σ detection of 13C18O towards Haro 6-10, with a relatively narrow linewidth of 0.7 ± 0.15 km s-1. A line of similar width is also detected towards AB Aur, at the 4σ level. In the later source, as the disk emission spreads over 2−3 km s-1, this must come from the molecular cloud, and implies that this cloud also contributes to the signal of the other isotopologues.
Finally, emission at the 3σ level appears towards Haro 6-10, MWC 480 and GG Tau near the expected frequency of the HC3N J = 23−22 transition, but these features are either too broad, too narrow, or not at the right velocity. No other significant feature appears anywhere else in the observed bandwidth.
4. Discussion
4.1. Using CN as a disk tracer
Our main approach to test whether CN is a disk tracer is to assume that the (mean) CN surface density is independent of the disk properties. This assumption is sustained by several independent arguments. First, the imaging study of DM Tau, LkCa 15 and MWC 480 by Chapillon et al. (2012) give similar CN surface densities in the 3 objects. Second, chemical modeling performed to interpret these CN images predict that the CN surface density is rather insensitive to the disk mass, varying by only ± 30% for masses differing a factor 3 in both directions. A similar result was found by Jonkheid et al. (2007) in their models for disk around HAe stars. Last, from an observational point of view, our analysis shows that the CN line optical depth does not appear to exhibit wide variations. We thus assume the CN line opacity to be constant (and relatively small), apart from the 3 sources in which it is clearly determined. Under this assumption, the total flux is directly related to the total number of CN molecules, i.e. principally by the disk outer radius ( ).
).
For a quantitative derivation of Rout, we use the approach of Guilloteau & Dutrey (1998) which shows that, at moderate inclinations (20° < i < 70°), the line flux from a Keplerian disk is related to local line width and disk outer radius: 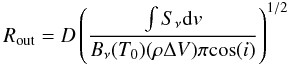 (2)where D is the distance (140 pc), T0 the excitation temperature, ΔV the local line width, i the inclination, and ρ a factor depending on line opacity along the line of sight. The rationale for and derivation of Eq. (2) are given in Appendix D. In the optically thin regime, ρ is proportional to the opacity, which is itself inversely proportional to cos(i), so the dependency on inclination disappears, and the flux just scales with the total number of molecules. In this optically thin case, Eq. (2) can be extrapolated to low inclinations i < 20°. For nearly edge-on objects, where the above formula breaks, Beckwith & Sargent (1993) have shown that the expected flux is not a strong function of inclination. Hence the apparent dependence on i essentially vanishes. We thus use ρcos(i) = 0.3cos(45°) for all sources in which the opacity cannot be determined from our spectra, and, for the few sources in which τ is determined by the HFS fit, we use ρcos(i) = τcos(45°). However, larger disks with smaller average line opacity can equally fit the data: in this respect, the derived radii are thus likely to be lower limits to the true CN disk size.
For the other parameters, we take ΔV = 0.2 km s-1, a value consistent with the local line width determined in the disks of DM Tau, LkCa 15 and MWC 480 by Piétu et al. (2007) and Chapillon et al. (2012). For the temperature, Chapillon et al. (2012) derived 30 K for MWC 480, but values (10–15 K) for DM Tau and LkCa 15. We used 15 or 30 K according to our best knowledge of source properties. Note that the derived disk radius will scale as  (Eq. (2)). The assumed temperatures and derived disk radii are given in Table 5 for a uniform disk distance of 140 pc. Given the uncertainty on the CN opacity, these radii should only be interpreted as estimates of the disk size. They range from <200 AU for non detection, to >1000 AU for the brightest sources. For MWC 480 and DM Tau, the derived radius is in good agreement with the more accurate determination from interferometric data of Chapillon et al. (2012), justifying a posteriori our choice of parameter values.
For T Tau and Haro 6-10, the CN line opacity is reasonably well constrained. The large disk radii which are derived make the disk interpretation very unlikely, as both objects contain multiple systems with strong evidence for tidal truncation of the embedded circumstellar disks to outer radii <60 AU (Akeson et al. 1998; Guilloteau et al. 2011). Both systems also display clear evidence for high velocity wings in CO, indicating powerful molecular jets. Hence, for these objects, CN may come from the outflows rather than from a circum-stellar/binary disk. As the line width are however limited, it is also possible that a substantial fraction of CN comes from the extended envelope in which these objects are embedded.
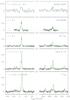 |
Fig. 10 Hyperfine components of CN in bright, potentially thick sources. The best fit with the hyperfine components is overlaid. The intensity scale is |
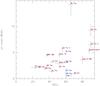 |
Fig. 11 CN line width (km s-1) as a function of disk inclination. Sources with unknown inclinations are in blue: we used i = 60° as the most likely value. Sources with outflows were excluded. |
For DG Tau, although modeling performed by Salter et al. (2011) shows the CN line intensity can be produced by a large Keplerian disk, we suspect that a similar situation occurs because of the strong outflow and complex, clearly non Keplerian, circumstellar environment (see Appendix A for more details on this source).
For other sources, a disk origin for the CN emission is inferred from the following qualitative arguments:
-
The line-width Δv derived from the Gaussian fit is of the order of 2−4 km s-1, as expected for a Keplerian disk orbiting a star of 0.5−2 M⊙.
-
Larger line widths are found for the more inclined objects (see Fig. 11). This figure does not correct for stellar mass: doing so would improve the correlation between line width and inclination.
-
The CN outer radius is within 300−600 AU, in good agreement with the range of interferometrically derived radii in previously imaged Keplerian disks.
-
In objects which have already been imaged in CN, MWC 480, DM Tau, LkCa 15 (Chapillon et al. 2012), GM Aur and AA Tau (Öberg et al. 2010), CN unambiguously comes from the disk, even in the confused case of AA Tau.
To the 24 sources detected in CN in our sample, we should add 5 more disks: GM Aur (Öberg et al. 2010), LkCa 15 (Chapillon et al. 2012), CI Tau, CY Tau, and GO Tau (Guilloteau et al., in prep.), leading to a total of 29 detections out of 47 objects. 3 (Haro 6-10, T Tau and DG Tau) are very unlikely to be disks, and, on the basis of the existence of outflows and SO detection, 2 more are perhaps outflows (HL Tau and CB26). This still leads to a disk detection rate of at least 24/47, i.e. ≳50% at our sensitivity level of ~0.1 Jy km s-1. Furthermore, in most disks, the CN N = 2−1 intensity is within a factor 2 of that of 13CO J = 2−1 (see Fig. 9).
This demonstrates the ability of the CN 2–1 line to be a good tracer of disk kinematics for stars still embedded in molecular clouds whose CO and 13CO line emission could confuse the disk emission profile.
4.2. Molecular disk properties
Our study is the first large, sensitive survey for 13CO, CN, ortho-H2CO, and SO towards disk around Class II PMS stars. Detailed sensitive studies of several molecules concerned only a few objects: in Taurus only GG Tau, DM Tau, LkCa 15 and MWC 480 (Dutrey et al. 1997; Guilloteau et al. 1999; Thi et al. 2004; Piétu et al. 2007; Chapillon et al. 2012; Dutrey et al. 2011). Previous multi-molecule surveys were limited to a dozen objects, and in general biased towards the brightest disks, either in CO (e.g. the DISCS survey of Öberg et al. 2011), or in continuum (Salter et al. 2011, used a minimum 1.3 mm continuum flux of 75 mJy). We reach here a sensitivity level (~0.1 Jy km s-1) comparable to or better than that of Öberg et al. (2011), and 5 to 10 times better than that of Salter et al. (2011). Furthermore, the smaller beam size of the 30-m allows to better isolate confusion cases compared to the JCMT study of Salter et al. (2011). The improved sensitivity allows us to detect many more sources, such as FT Tau, IQ Tau, V806 Tau (Haro 6-13), UZ Tau, DN Tau, DO Tau in the Salter et al. sample. Excluding sources detected in SO which are presumably contaminated by outflows, we have a total of 32 sources4 (out of 47) which exhibit CN, 13CO or H2CO emission from a disk, i.e. 68% of the sample.
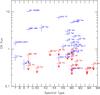 |
Fig. 12 Correlation between CN line flux (main fine structure group, in Jy km s-1) and stellar spectral type. Blue is for detected sources, red for upper limits. Sources with outflows were excluded. Emission in AB Aur is from the envelope. |
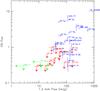 |
Fig. 13 As Fig. 12, but for CN line flux (main fine structure group) vs. 1.3 mm continuum flux (in mJy). |
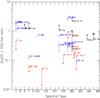 |
Fig. 14 Correlation between the H2CO to CN flux ratio and stellar spectral type. Red indicates upper limits (no H2CO), black lower limits (no CN). H2CO in FN Tau and CIDA 8 is likely to be cloud contamination. Outflow sources are in italics. |
Figures 12 and 13 explore possible correlation of the CN intensity with spectral type of the star and 1.3 mm continuum flux of the disk respectively. Figure 14 considers the H2CO/CN intensity ratio vs. the stellar spectral type. Despite the large sample size, no correlations are apparent. This lack of correlation is also observed for other stellar parameters (mass loss, X-ray luminosity). However, a number of properties emerge from these correlation plots.
First, CN line is relatively weak (in fact undetected so far) in the hottest stars in our sample (SU Aur, CQ Tau, MWC 758, AB Aur), although MWC 480 and HD 163296 exhibit strong CN emission (Fig. 12). The rather poor molecular content of AB Aur has been shown to be a consequence of its strong UV flux by Schreyer et al. (2008). The UV flux penetration may furthermore be enhanced by the large inner cavity (radius ~100 AU) of AB Aur (Piétu et al. 2005). A similar situation may occur for MWC 758 due to its ~40 AU cavity (Isella et al. 2010b). Chapillon et al. (2008, 2010) argue that CQ Tau is gas deficient. Little is known about the gas disk of SU Aur, but the strong X-ray luminosity of SU Aur may play a role in lowering the molecular abundances. MWC 480 and HD 163296 have strong CN. Contrary to AB Aur, CQ Tau and MWC 758 which are Type I sources, these two sources are Type II according to the classification of Meeus et al. (2001), which can indicate self-shadowed disks. Such a configuration would seriously limit the UV penetration, leading to a chemical composition much more similar to those of T Tauri disks.
Second, at the level of our sensitivity, we do not detect the CN line for spectral types cooler than M1.5 (Fig. 12). Assuming similar CN column densities than in the warmer stars, our sensitivity translates into upper limits of order 150−250 AU for the disk outer radius. Thus, our negative result may only be the consequence of smaller disk sizes for lower mass stars, rather than implying a change in chemistry at this spectral type threshold.
Third, although CN intensity does not correlate with the continuum flux at 1.3 mm (Fig. 13), which is a tracer of the dust mass, there is a clear threshold. Only 4 sources with Sν(1.3 mm) > 60 mJy are undetected in CN (CW Tau, CQ Tau, DQ Tau, and DR Tau which has been observed with relatively limited sensitivity) while only 4 sources are detected among the 17 sources with Sν(1.3 mm) ≤ 60 mJy.
Comparing the emissions from CN and H2CO, we find that to first order, the H2CO/CN ratio divides the sources in two categories (see Fig. 14). [H2CO/CN] > 0.5 is found in warm sources (Herbig Ae stars) or outflow/envelope dominated objects, while it is below 0.3 for the disk sources. This trend is consistent with our current understanding of chemistry. In disks, H2CO is formed in the gas phase and on grains (Semenov & Wiebe 2011). Therefore, H2CO can be released in the gas phase at high enough temperatures, either because of large stellar flux (HAe stars) or because of shock heating (outflow sources). Enhanced abundance of H2CO has been observed in many outflows (e.g. Bachiller et al. 2001; Tafalla et al. 2010). As a consequence, sources with weak or no H2CO emission mostly correspond to cold objects without outflows. While CN appears as a clear disk tracer in the M1-K5 spectral type range, the situation is more complex for the HAe stars, for which H2CO is sometimes a better probe than CN, but remains weak. Using the Baraffe et al. (1998) tracks, the M1 limit corresponds to about 0.5 M⊙ for stars in the 1 to 3 Myr age.
Sulfur-bearing molecules (CS, SO, H2S and CCS) have been recently searched by Dutrey et al. (2011) and Chapillon et al. (2012) in the four disks surrounding MWC 480, LkCa 15, GO Tau and DM Tau. So far, only CS has been detected, neither SO nor H2S. Our survey provides a much larger sample for SO, and confirms its general weakness in disks (only one source detected, 04302+2242, our results contradicting the detection in AB Aur reported by Fuente et al. 2010). On the other hand, we find SO to be ubiquitous in outflow sources. The SO chemistry in disks is not fully understood: current models predict too much SO and H2S molecules (Dutrey et al. 2011), most likely as a result of incomplete treatment of Sulfur chemistry on grain surfaces. However, SO is a clear tracer of shocks, with high abundances in extremely high velocity outflows (Tafalla et al. 2010).
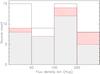 |
Fig. 15 Histogram of detections as a function of 1.3 mm continuum flux range. Filled: disks, hatched: outflow contaminated sources, empty: non detections. |
The absence of correlations in Figs. 12, 13 justifies a posteriori our simple source-independent hypothesis (essentially constant CN surface density) to interpret the line emission. In this framework, the CN flux is a simple tracer of disk size, and our study shows that at least 50% of the young stars are surrounded by large (≳300 AU) disks, in our specific case of isolated star formation. The overall disk detection rate is displayed in Fig. 15. Hatched areas are for sources with molecular outflows (traced by SO), filled areas are disks detected in CN, 13CO or H2CO, and empty histograms non detections. The distribution of disk sizes exhibits a strong peak near 300 AU; however, because of sensitivity limitations, our survey becomes incomplete for smaller disk sizes.
It is beyond the scope of our angularly unresolved data to provide detailed modeling of the disk emission for individual objects. The above considerations on the detected lines are broadly consistent with prior knowledge of disk chemistry. The large CN detection rate supports the simple idea that CN is present only in a photodissociation layer above the disk plane, with a relatively uniform surface density over a large range of source properties (Jonkheid et al. 2007; Chapillon et al. 2012). The lower detection rate for sources with low 1.3 mm flux may be the result of a change of chemical regime for disks with low mass. However, it is also consistent with a simpler idea, namely that these faint disks are just much smaller than the others. Higher sensitivity, spatially resolved observations can solve this issue.
5. Summary
We have performed a sensitive survey of 42 young stars probing isolated star formation regions in CN, ortho-H2CO, SO, 13CO and C17O rotational lines near 206−228 GHz with the IRAM 30-m telescope. It reveals that:
-
13CO is strongly affected by confusion, either from molecular clouds, or from outflows and envelopes.
-
CN is a good, nearly confusion free, tracer of disks for stars in the M1-K5 spectral type range (i.e. stars more massive than about 0.5 M⊙ according to the Baraffe et al. (1998) tracks).
-
The warmest stars exhibit two very different behaviours: some have strong CN, but most have undetectable CN and weak H2CO emission.
-
SO is ubiquitously found in outflow-driving, embedded sources, but exceptional in disks (only 1 source). When SO is present, H2CO is stronger than CN.
-
CN N = 2−1 is strong enough to be a good tracer of disk kinematics in at least half of the objects.
-
The disk detection rate in CN lines exceeds 50%. The detected disks are large, ≳300 AU in radius.
-
The overall gas disk detection rate (by any molecular tracer) is ≈ 68%. However, gas disk detection is much more difficult for sources with small (≤ 60 mJy) 1.3 mm continuum flux. We cannot distinguish at present whether this is due to smaller disk masses or smaller disk sizes (<200 AU radius).
Online material
Appendix A: Comments on individual sources
-
FN Tau: the tentative detection of H2CO is at an unusual velocity of −0.5 km s-1.
-
CW Tau is dominated by confusion (see discussion in Appendix C). Despite strong confusion, line wings of 13CO could indicate a disk at velocity 6.2 km s-1 and with a line width of 3.3 ± 0.4 km s-1. CW Tau drives a bipolar outflow that can be traced in optical forbidden lines over 4″−6″ along both outflow directions (Hirth et al. 1994).
-
CIDA 1 (Briceno et al. 1993) is a late spectral type object (M5.5 White & Basri 2003), with weak 1.3 mm continuum emission (Schaefer et al. 2009). The line of sight towards CIDA 1 intercepts the same molecular cloud than that of CW Tau and is highly confused. The tentative fit of the 13CO line wing is not conclusive on the presence of a disk.
-
BP Tau harbors a small (120 AU radius) disk (Dutrey et al. 2003) and strong confusion in 12CO. No signal at all is detected in these new observations, but the sensitivity towards this source is lower than average.
-
DE Tau has relatively weak 1.3 mm continuum (36 mJy). There is some confusion in 13CO, but no evidence for disk emission.
-
RY Tau: the CN detection is marginal (3.5σ). A fit of a 3 km s-1 wide Gaussian to the 13CO spectrum also indicate a potential disk, at the 5σ level, but with a different velocity. RY Tau is a suspected close binary, with separation >3 AU (Bertout et al. 1999). Velocity measurements by Nguyen et al. (2012) indicate a possible SB1 with radial heliocentric velocity in the range 16.7−19.4 km s-1, which is equivalent to 7.7−10.4 km s-1 in the LSR, and more consistent with the 13CO velocity. High resolution image at 1.3 mm by Isella et al. (2010a) indicate an inclination of 66° and a morphology consistent with a deficit of emission in the inner 15 AU.
-
T Tau is a triple system, with a compact (~60 AU) circumstellar disk around the single T Tau N (Akeson et al. 1998; Guilloteau et al. 2011). Its molecular environment is complex, and all the detected lines are most likely coming from an outflow or heated envelope, perhaps the outflowing cavity walls imaged in 13CO by Momose et al. (1996).
-
Haro 6-5 B, also known as FS Tau B, is a nearly edge-on, deeply embedded object. Confusion in 13CO is very strong. Previous interferometric measurements of 13CO J = 1−0 revealed a complex region (Dutrey et al. 1996). HST images indicate a 300 AU radius disk at high inclination, 70−80° (Krist et al. 1998; Padgett et al. 1999). FS Tau B possess a jet and a counterjet, as well as an optically visible cavity wall (Liu et al. 2012). Our combined detection of CN and H2CO may indicate a compact, warm disk or some emission from an outflow or envelope. 5′′ resolution images in 13CO J = 1−0 with the NMA (Yokogawa et al. 2002) revealed a disk at VLSR ≈ 7.0 km s-1, with a kinematics dominated by rotation. They indicate motions compatible with Keplerian motions around a central star of 0.25 M⊙ only. Given the high confusion level, this value may be unreliable. Our CN line width, though unprecise, suggests a higher stellar mass. The asymmetric H2CO spectrum may be affected by confusion in the blueshifted part.
-
FT Tau is a deeply embedded, low luminosity star with unknown spectral type. A compact (60 AU) dust disk was resolved by Guilloteau et al. (2011), who also detected 12CO emission, suggesting a small disk at low inclination around a 0.7−1.0 M⊙ star. The clear detection of CN confirms the disk interpretation. 13CO emission from the disk may be present at redshifted velocities compatible with CN, but confusion makes any quantitative estimate impossible.
-
DG Tau is a well studied object, driving an optical microjet. The system inclination remain unclear: between 38 and 45° from the jet (Pyo et al. 2003; Eislöffel & Mundt 1998), and 20 to 32° from the dust disk (Isella et al. 2010a; Guilloteau et al. 2011). Images in 13CO (2−1) (Testi et al. 2002) indicate a complex morphology, a large fraction of the emission coming from a remnant envelope (see also Kitamura et al. 1996). There is no clear evidence for Keplerian rotation. The relatively narrow lines of H2CO and SO could originate from this remnant envelope. CN(2−1) was previously detected by Salter et al. (2011)5, who modeled this as coming from a Keplerian disk. Our CN line width is consistent with the measurement of Salter et al. (2011), but the large derived outer radius, combined with the complex morphology, suggests CN is most likely coming from the outflow or the remnant envelope.
-
DG Tau B is a totally obscured object, driving a powerful one-sided molecular outflow (Mitchell et al. 1997). High inclination (64−75°, see Guilloteau et al. 2011; Eislöffel & Mundt 1998) however yield moderate line-of-sight velocities for the outflow. The rich spectrum may originate from the outflow, but CN lacks the narrow component detected in H2CO and C17O, which is presumably due to the molecular cloud.
-
Haro 6-10 (also known as GV Tau) is a close binary, with two compact (<30 AU), optically thick, circumstellar disks (Guilloteau et al. 2011), but no known circumbinary disk. The circumstellar disks are misaligned and the system is embedded in a common envelope (Roccatagliata et al. 2011). H2O maser emission has been recently reported, and suggest that the Southern component is itself a close binary (Wilking et al. 2012). As for DG Tau B, the CN line is much wider than those of H2CO and C17O. The proeminent red wing in 13CO is likely to trace the outflow.
-
IQ Tau was observed in 12CO by Schaefer et al. (2009), who did not detect any significant emission with the IRAM Plateau de Bure interferometer at 5′′ resolution. The CN emission exhibits the clear signature of Keplerian rotation (although the expected double peaked aspect is reduced because of the hyperfine component blending). CN is apparently stronger than 13CO in this source. A tentative fit of a disk component to the 13CO spectrum suggest the redshifted emission may still be masked by the cloud.
-
LkHa 358: 13CO is heavily confused. A small molecular disk was reported from interferometric measurements by Schaefer et al. (2009) from 12CO emission. An attempt to fit a disk component to the 13CO line wings is consistent with this interpretation, provided 13CO has significant optical depth (>2 on average). The narrow emission from C17O most likely comes from the surrounding cloud, as the ~3.5σ signal from H2CO.
-
HH 30: Pety et al. (2006) had previously imaged the 13CO emission from this emblematic edge-on object. The narrow line from C17O likely comes from the cloud, as the ~3σ signal from H2CO.
-
HL Tau is the archetype of the deeply embedded, outflow driving sources. The redshifted side of the outflow is known to be brighter (Cabrit et al. 1996; Monin et al. 1996). From the line profiles, C17O, H2CO and especially SO (which is significantly redshifted), must come from the outflow. However, the CN line is much narrower and exhibit a systemic velocity of 4.7 km s-1, and thus could be a pure disk tracer.
-
HK Tau is a binary star, with one component exhibiting an edge-on disk (McCabe et al. 2011). The relatively broad CN line is consistent with emission from this edge-on disk around HK Tau B. The blue shifted side of the disk may also have been detected in 13CO.
-
Haro 6-13, also known as V 806 Tau, was imaged in 12CO by Schaefer et al. (2009), who based on agreement in position angle between CO and dust emission, attributed the emission to a disk of at least 180 AU radius. HCO+3–2 emission has been detected by Salter et al. (2011). The H2CO spectra are complex, as the C17O one, and perhaps result of superposition of relatively broad emission with a narrow (0.5 km s-1) absorption feature.
-
GG Tau was included as a reference source in our sample. Our results agree with the initial detections of Dutrey et al. (1997). H2CO is well detected in the combined spectrum.
-
UZ Tau E is a spectroscopic binary part of the UZ Tau hierarchical quadruple system. The CO disk was detected by Simon et al. (2000), who found an inclination of 55° and an outer radius of 300 AU. Our derived radius from CN is in excellent agreement with this value. 13CO emission from the disk is also detected, in the line wings, but still exhibits confusion.
-
IRAS 04302+2247 (the Butterfly star Wolf et al. 2003), is an edge-on system. Recent IRAM interferometric measurements indicate a stellar mass of order 1.6 M⊙ and a disk radius of 260 AU (Dutrey et al., in prep.). Although this source exhibits a large H2CO/CN ratio, which we in general attribute to outflows, the H2CO and SO emissions come from the disk. From the hyperfine ratios, CN appears potentially optically thick in this source, in which case the emission must be dominated by smaller radii. The rather large linewidth concurs with this interpretation.
-
DL Tau was imaged in 12CO by Simon et al. (2000) who pointed out the strong confusion making the inclination derivation unreliable. Confusion is also large in 13CO, masking all the emission except for the red-shifted wing. Like IQ Tau, DL Tau shows strong, double peaked line profile in CN. The outer radius derived from CN is consistent with the value quoted by Simon et al. (2000) for CO. H2CO is also detected.
-
AA Tau: CN is clearly detected, and weak emission is also visible in 13CO, despite confusion. However, the disk contribution in 13CO is much smaller than the intensity reported by Greaves (2005) (0.6 K km s-1 at JCMT, i.e. 12 Jy km s-1), which must have included cloud emission. CN in AA Tau was discovered by Öberg et al. (2010). We recover only about half of their quoted flux (1.7 Jy km s-1), and our derived velocity suggests that the blue-shifted part of the CN spectrum is masked by confusion, like the 13CO one.
-
DN Tau is very similar to DL Tau and IQ Tau, with CN stronger than 13CO. Schaefer et al. (2009) failed to detect 12CO from this object with the IRAM interferometer, again presumably because of strong confusion with the cloud.
-
DO Tau shows clear CN detection (4σ), but the line width is poorly constrained. The line can be narrow, so (positive) contamination by the cloud is not fully excluded. Identification of a disk component in 13CO is difficult, as the redshifted side is dominated by the cloud.
-
HV Tau C, like HK Tau B, is a compact (80 AU radius) edge on disk in a multiple system, here a hierarchical triple. 12CO emission from the disk was resolved by Duchêne et al. (2010) with the IRAM array. The broad CN line (ΔV = 6 km s-1) is consistent with an origin in a compact disk. The CN flux suggests a somewhat larger radius (300 AU in Table 5), or equivalently, non negligible optical depth. The observed hyperfine ratios are indeed compatible with substantial optical depth, τ = 7.0 ± 2.7, which would also yield a lower line width, 4.2 ± 0.6 km s-1. 13CO emission from the disk produces the line wings visible in Fig. B.26
-
Haro 6-33 (also known as IRAS 04385+2550) was detected in 12CO by Schaefer et al. (2009), who interpreted the emission as coming from a Keplerian disk, despite strong confusion. There is also substantial cloud contamination in 13CO, but CN and H2CO are detected. The derived disk radius in CN is in good agreement with the 12CO result.
-
DQ Tau exhibits huge confusion, and no detection at all.
-
DR Tau was reported as tentatively detected in CN(2−1) by Salter et al. (2011) at a velocity of 11 km s-1 with an integrated flux of 3.5 ± 1.3 Jy km s-1. Our spectrum shows no line at all, with a 3σ upper limit on the flux of 1.4 Jy km s-1. Confusion with the cloud is huge in 13CO: only the red wing between 10 and 11 km s-1 may be attributable to a disk component.
-
DS Tau shows no apparent confusion. A weak (4σ) line is detected when combining both o-H2CO transitions, with a velocity (6.0 km s-1) and linewidth (3 km s-1) consistent with disk emission, but no CN or 13CO.
-
UY Aur is a 0.8′′ separation binary system. The 13CO line is strong, and consistent with an origin in the complex circumbinary structure imaged by Duvert et al. (2000). There is a 4σ detection of H2CO with a compatible kinematics.
-
AB Aur: the strong 13CO line emanates from a combination of the disk/ring structure imaged by Piétu et al. (2005) and the surrounding envelope. The clear detection of C17O confirms the large CO content of this source. H2CO is convincingly detected, confirming the result of Fuente et al. (2010) using the para-H2CO 30,3 − 20,2 line at 218.2 GHz. However, we find no evidence at all for CN or SO from the disk, which were claimed to be detected by these authors. We only have a narrow (0.4 km s-1), 3.5σ feature in CN(2−1) at a velocity consistent with cloud emission. The CN (1−0) line quoted by Fuente et al. (2010) must have been residual emission from the cloud. For SO, they report a line intensity of 26 mK km s-1 for the 34 − 23 line, and 60 mK km s-1 for the 56 − 45 transitions, while we obtain a 3σ upper limit of 21 mK km s-1 for the 54 − 43 using the AB Aur velocity and line widths. Note that Fuente et al. (2010) used a larger throw (120′′) than us in the wobbler switching, so that their results are more susceptible to residual emission from the envelope.
-
SU Aur: despite confusion with the cloud, the 13CO spectrum exhibits a broad component compatible with emission from a disk. No other molecule is detected. SU Aur is a strong X-ray source (Franciosini et al. 2007). Near IR imaging indicates a highly inclined disk (≃ 65°) and outflow cavity walls (Akeson et al. 2002; Chakraborty & Ge 2004).
-
MWC 480 was included here as a reference source in our sample. It has been extensively studied with the IRAM mm array (Piétu et al. 2007; Chapillon et al. 2012). We find the double peaked 13CO profile characteristic of an isolated Keplerian disk. CN emission is in excellent agreement with the interferometric results of Chapillon et al. (2012). The detection of C17O for the first time in this source confirms the significant CO abundance in this object. Note that, as expected, the C17O profile is apparently larger than the 13CO one.
-
CB26 is a deeply embedded, edge-on object driving an unusual outflow (Launhardt et al. 2009) in an isolated Bok globule. Like in HL Tau, we detect here strong H2CO and SO emission, but only a weak CN line. If interpreted by disk emission, the CN line is consistent with a disk size about 250 AU.
-
CIDA 8 has weak continuum emission and no CO disk from interferometric measurements of Schaefer et al. (2009). Cloud contamination exists, but appears limited to a very narrow velocity range. There is a surprising detection of H2CO just outside the range visibly contaminated in 13CO, but with a narrow line width which suggests it originates from a cloud.
-
CIDA 11 shows no detection at all. It was also not detected in continuum and CO by Schaefer et al. (2009).
-
RW Aur is a binary system that was imaged in 12CO by Cabrit et al. (2006), who find evidence for a very small (50 AU radius) disk, but did not detect 13CO emission. Our negative result is consistent with their findings.
-
MWC 758 is a 1.8 M⊙ star surrounded by a disk where CO is apparently depleted and mostly optically thin (Chapillon et al. 2008), despite high temperatures (30 K). We find a relatively weak line of 13CO, consistent with this interpretation. No other molecule is detected: the marginal signal in C17O is not at the expected disk velocity. The limited CO opacity could be related to the large cavity detected by Isella et al. (2010b) in continuum.
-
CQ Tau is a “twin” of MWC 758, also exhibiting a warm (>50 K) disk with optically thin CO emission (Chapillon et al. 2008), but its continuum emission is strongly centrally peaked (Banzatti et al. 2011; Guilloteau et al. 2011). Although different distances are often quoted based on Hipparcos parallax, these differences are not significant and Chapillon et al. (2008) argue that both CQ Tau and MWC 758 are also located at 140 pc. We also detect 13CO with a similar intensity than in MWC 758. H2CO is detected at the 5σ level, with kinematic parameters quite consistent with those derived from 13CO. However, we find no evidence for CN. Our 3σ limit of 0.28 Jy km s-1 is marginally consistent with the flux of 0.22 ± 0.11 Jy km s-1 reported by Öberg et al. (2010).
-
HD 163296 is an isolated Herbig Ae star located at 120 pc (van Leeuwen 2007). It harbours a large (~550 AU) CO disk inclined at about 45° (Isella et al. 2007), and has been extensively studied in CO isotopologues, including C17O (Qi et al. 2011). CN N = 3−2 was detected by Thi et al. (2004). The strong CN N = 2−1 emission is compatible with an optically thin line. The outer radius in Table 5 is slightly larger than that measured from CO. The discrepancy may have several origins. First, as the star is very luminous, CN may be in a warmer region. Second, Hughes et al. (2011) report a rather large turbulence level (≃ 0.3 km s-1) from CO measurements, larger than assumed. We also report the first detection of H2CO, through the ortho-H2CO 313 − 212 transition. Comparison of our 13CO spectrum to the interferometric result of Qi et al. (2011) suggest some contamination near 2−4 km s-1 (and also 13 km s-1 as in the 12CO spectra of Qi et al. 2011).
Appendix B: Spectra for individual sources
This appendix displays the spectra towards the various sources. For each source, the top panel shows the 13CO J = 2−1 spectrum. The continuous red line, if present, is a Gaussian fit obtained after masking the confused velocity range. The bottom panel displays on a common scale from top to bottom the spectra of: 13CO J = 2−1 (with fit as in top panel), C17O J = 2−1, CN N = 2−1, ortho H2CO 313 − 212, ortho H2CO 312 − 211, the average of both o-H2CO transitions, and SO 54 − 43, arbitrarily shifted in intensity to avoid overlap. The intensity scale is antenna temperature ( in K): conversion to flux density can be obtained using a factor of 9 Jy/K.
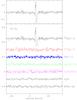 |
Fig. B.1 Spectra of the observed transitions towards FN Tau. |
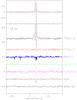 |
Fig. B.2 Spectra of the observed transitions towards CW Tau. |
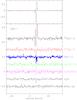 |
Fig. B.3 Spectra of the observed transitions towards CIDA-1. |
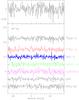 |
Fig. B.4 Spectra of the observed transitions towards BP Tau. |
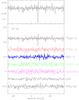 |
Fig. B.5 Spectra of the observed transitions towards DE Tau. |
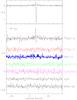 |
Fig. B.6 Spectra of the observed transitions towards RY Tau. |
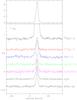 |
Fig. B.7 Spectra of the observed transitions towards T Tau. |
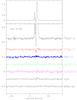 |
Fig. B.8 Spectra of the observed transitions towards Haro 6-5 B. |
 |
Fig. B.9 Spectra of the observed transitions towards FT Tau. |
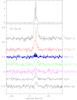 |
Fig. B.10 Spectra of the observed transitions towards DG Tau B. |
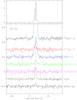 |
Fig. B.11 Spectra of the observed transitions towards DG Tau. |
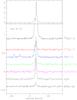 |
Fig. B.12 Spectra of the observed transitions towards Haro 6-10. |
 |
Fig. B.13 Spectra of the observed transitions towards IQ Tau. |
 |
Fig. B.14 Spectra of the observed transitions towards LkHa 358. |
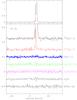 |
Fig. B.15 Spectra of the observed transitions towards HH 30. |
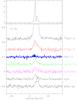 |
Fig. B.16 Spectra of the observed transitions towards HL Tau. |
 |
Fig. B.17 Spectra of the observed transitions towards HK Tau. |
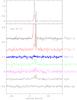 |
Fig. B.18 Spectra of the observed transitions towards Haro 6-13. |
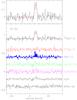 |
Fig. B.19 Spectra of the observed transitions towards GG Tau. |
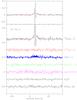 |
Fig. B.20 Spectra of the observed transitions towards UZ Tau E. |
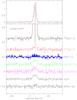 |
Fig. B.21 Spectra of the observed transitions towards 04302+2247. |
 |
Fig. B.22 Spectra of the observed transitions towards DL Tau. |
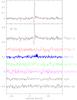 |
Fig. B.23 Spectra of the observed transitions towards AA Tau. |
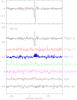 |
Fig. B.24 Spectra of the observed transitions towards DN Tau. |
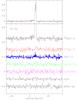 |
Fig. B.25 Spectra of the observed transitions towards DO Tau. |
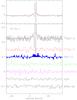 |
Fig. B.26 Spectra of the observed transitions towards HV Tau C. |
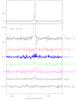 |
Fig. B.27 Spectra of the observed transitions towards Haro 6-33. |
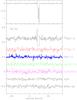 |
Fig. B.28 Spectra of the observed transitions towards DQ Tau. |
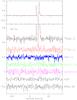 |
Fig. B.29 Spectra of the observed transitions towards DR Tau. |
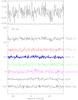 |
Fig. B.30 Spectra of the observed transitions towards DS Tau. |
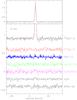 |
Fig. B.31 Spectra of the observed transitions towards UY Aur. |
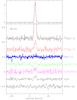 |
Fig. B.32 Spectra of the observed transitions towards AB Aur. |
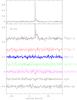 |
Fig. B.33 Spectra of the observed transitions towards SU Aur. |
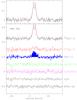 |
Fig. B.34 Spectra of the observed transitions towards MWC 480. |
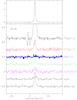 |
Fig. B.35 Spectra of the observed transitions towards CB 26. |
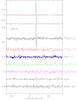 |
Fig. B.36 Spectra of the observed transitions towards CIDA-8. |
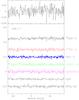 |
Fig. B.37 Spectra of the observed transitions towards CIDA-11. |
 |
Fig. B.38 Spectra of the observed transitions towards RW Aur. |
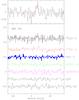 |
Fig. B.39 Spectra of the observed transitions towards MWC 758. |
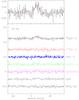 |
Fig. B.40 Spectra of the observed transitions towards CQ Tau. |
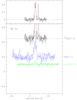 |
Fig. B.41 Spectra of the observed transitions towards DM Tau. |
 |
Fig. B.42 Spectra of the observed transitions towards HD 163296. The observed SO transition is not the same as in all other sources. |
Appendix C: The CW Tau/CIDA-1 line of sight
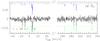 |
Fig. C.1 Spectra of CN towards CW Tau. The best fit with the hyperfine components is drawn below. The upper profile indicates the expected profile for an optically thin line. Detection of even weak components suggests high optical depth (~20−30). The intensity scale is |
CW Tau and CIDA-1, which are only separated by 1 arcmin, exhibit strong confusion in 13CO, and are the only sources in which confusion in CN is obvious. Confusion is also visible in H2CO and even C17O. In addition, in the Salter et al. (2011) study, CW Tau is the source which has extended HCO+ (3−2) emission.
In the beam-switched observations, the detection of hyperfine components of CN (Fig. C.1) suggests significant optical depth. Optically thick CN from clouds could introduce difficulties in using CN as a kinematical disk tracer, as it could absorb the disk emission. This potential problem is mitigated by several independent arguments. First, the cloud line width is small, so only a small fraction of disk kinematics will be affected. Second, CN has several hyperfine components, of very different opacities: this would help in modeling the absorption layer. Furthermore, anomalously high (τ ≫ 1) apparent opacities can be the result of opacity gradients in a cloud with more moderate (τ > 1) average opacity, as the strongest lines saturate first. However, observations of the CW Tau line of sight in frequency switching shows a flat-topped, 2 K line of 13CO, with a line width of 1.40 km s-1 and the same velocity than the CN signal, but no significant CN emission at a level of 50 mK (3σ). Thus, in the beam-switched observations, the detected signal probably originates from emission in one or both of the reference beams, and in the cloud, CN is most likely not much excited. Although high opacities cannot be excluded, the unusual hyperfine line ratios may also be related to weak excitation-dependent anomalies, since CN collision rates display significant dependencies on the hyperfine levels (Kalugina et al. 2012). Non negligible opacities, low excitation and possible hyperfine anomalies have already been reported for CN in dark clouds by Crutcher et al. (1984).
Appendix D: Formation of lines in Keplerian disks
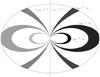 |
Fig. D.1 Regions of the disk which yield equal projected velocities vobs. The ellipse is the projection of the disk outer edge observed with an inclination of 45°. |
Line formation in a Keplerian disk is strongly constrained by the velocity gradient (Horne & Marsh 1986). We use here this property to explore to what extent the detected CN lines trace the (putative) circumstellar disks. Unless the disk is seen face on, only a fraction of the disk projects at any given velocity. This fraction can be estimated with simple reasoning: we follow here the derivation presented by Guilloteau et al. (2006). r,θ being the cylindrical coordinates in the disk plane, the line of sight velocity (in the system rest frame) is  (D.1)The locii of isovelocity are given by
  (D.2)with a finite local line width Δv (assuming rectangular line shape for simplification), the line at a given velocity Vobs originates from a region included between ri(θ) and rs(θ):
 ![\appendix \setcounter{section}{4} \begin{eqnarray} r_i(\theta) &=& \frac{GM_{*}}{(V_\mathrm{obs}+\Delta {v}/2)^2}\sin^2{i}\cos^2{\theta} \\ r_s(\theta) &=& \min\left[R_\mathrm{out},\frac{GM_{*}}{(V_\mathrm{obs}-\Delta \mathrm{v}/2)^2} \sin^2{i}\cos^2{\theta}\right]. \end{eqnarray}](/articles/aa/full_html/2013/01/aa20298-12/aa20298-12-eq242.png) Figure D.1 indicates the regions of equal projected velocities for 6 different values: Vobs > vd, Vobs = vd, Vobs < vd, and their symmetric counterpart at negative velocities, where vd:
Figure D.1 indicates the regions of equal projected velocities for 6 different values: Vobs > vd, Vobs = vd, Vobs < vd, and their symmetric counterpart at negative velocities, where vd:  (D.5)\newpage
is the projected velocity at the outer disk radius Rout. Figure D.1 shows that the fraction of the disk covered by the gas at velocities Vobs ≃ vd is of order Δv/vd, and drops very rapidly for larger velocities. The larger area covered for Vobs ≃ vd explains the classical double peaked line profiles emerging from Keplerian disks.
For moderately inclined (i < 70°) disks in Keplerian rotation, the integrated line flux is given by  (D.6)where T0 is the disk temperature (assumed uniform for simplicity), ΔV the local linewidth, Rout the disk outer radius, D is the source distance and i the disk inclination. ρ is a factor of order of the line of sight τl for optically thin lines, saturating as ∝ log (τl) for large optical depths (see Guilloteau & Dutrey 1998, their Fig. 4). The optically thick limit is obtained because of the Keplerian shears which, as demonstrated above, limits the maximum fraction of the disk covered at any velocity to δV/vd. δV is the local linewidth including opacity broadening, so δV ~ log (τl)ΔV for large opacities.
Note that as τl ≃ τp/cos(i), where τp is the line opacity perpendicular to the disk plane, and since τp ∝ Σ/ΔV, where σ is the molecule surface density, the (apparent) dependence on inclination and line width disappears for optically thin lines: the integrated line flux scales as the number of molecules.
From Eq. (D.6), we can derive the outer radius of the molecule distribution provided with have an estimate of ρ (D.7)Equation (D.7) is valid for single lines. For molecules with hyperfine structure like CN, line blending must be accounted for. We do so in taking into account the relative weight of the hyperfine components: the integrated flux of the J = 5/2−3/2 fine structure group presented in Table 3 is multiplied by 0.45 to obtain the flux in the strongest hyperfine component, which then used in Eq. (D.7) to derive the outer radius. The fitted opacity, if available, is used to provide an estimate of ρ (ρ = τ, τ being the sum of the opacities of all hyperfine components), which is otherwise set to 0.3.
See http://www.iram.fr/IRAMFR/GILDAS for more information about GILDAS softwares.
Acknowledgments
This work was supported by “Programme National de Physique Stellaire” (PNPS) and “Programme National de Physique Chimie du Milieu Interstellaire” (PCMI) from INSU/CNRS. The work of M.S. was supported in part by NSF grant AST 09-07745. This research has made use of the SIMBAD database, operated at CDS, Strasbourg, France.
References
- Akeson, R. L., Koerner, D. W., & Jensen, E. L. N. 1998, ApJ, 505, 358 [NASA ADS] [CrossRef] [Google Scholar]
- Akeson, R. L., Ciardi, D. R., van Belle, G. T., & Creech-Eakman, M. J. 2002, ApJ, 566, 1124 [NASA ADS] [CrossRef] [Google Scholar]
- Andrews, S. M., & Williams, J. P. 2005, ApJ, 631, 1134 [NASA ADS] [CrossRef] [Google Scholar]
- Bachiller, R., Pérez Gutiérrez, M., Kumar, M. S. N., & Tafalla, M. 2001, A&A, 372, 899 [NASA ADS] [CrossRef] [EDP Sciences] [Google Scholar]
- Banzatti, A., Testi, L., Isella, A., et al. 2011, A&A, 525, A12 [NASA ADS] [CrossRef] [EDP Sciences] [Google Scholar]
- Baraffe, I., Chabrier, G., Allard, F., & Hauschildt, P. H. 1998, A&A, 337, 403 [NASA ADS] [Google Scholar]
- Beckwith, S. V. W., & Sargent, A. I. 1993, ApJ, 402, 280 [NASA ADS] [CrossRef] [Google Scholar]
- Bertout, C., Robichon, N., & Arenou, F. 1999, A&A, 352, 574 [NASA ADS] [Google Scholar]
- Bertout, C., Siess, L., & Cabrit, S. 2007, A&A, 473, L21 [NASA ADS] [CrossRef] [EDP Sciences] [Google Scholar]
- Bouvier, J., Chelli, A., Allain, S., et al. 1999, A&A, 349, 619 [NASA ADS] [Google Scholar]
- Briceno, C., Calvet, N., Gomez, M., et al. 1993, PASP, 105, 686 [NASA ADS] [CrossRef] [Google Scholar]
- Briceño, C., Luhman, K. L., Hartmann, L., Stauffer, J. R., & Kirkpatrick, J. D. 2002, ApJ, 580, 317 [NASA ADS] [CrossRef] [Google Scholar]
- Cabrit, S., Guilloteau, S., Andre, P., et al. 1996, A&A, 305, 527 [NASA ADS] [Google Scholar]
- Cabrit, S., Pety, J., Pesenti, N., & Dougados, C. 2006, A&A, 452, 897 [NASA ADS] [CrossRef] [EDP Sciences] [Google Scholar]
- Chakraborty, A., & Ge, J. 2004, AJ, 127, 2898 [NASA ADS] [CrossRef] [Google Scholar]
- Chapillon, E., Guilloteau, S., Dutrey, A., & Piétu, V. 2008, A&A, 488, 565 [NASA ADS] [CrossRef] [EDP Sciences] [Google Scholar]
- Chapillon, E., Parise, B., Guilloteau, S., Dutrey, A., & Wakelam, V. 2010, A&A, 520, A61 [NASA ADS] [CrossRef] [EDP Sciences] [Google Scholar]
- Chapillon, E., Guilloteau, S., Dutrey, A., Piétu, V., & Guélin, M. 2012, A&A, 537, A60 [NASA ADS] [CrossRef] [EDP Sciences] [Google Scholar]
- Crutcher, R. M., Churchwell, E., & Ziurys, L. M. 1984, ApJ, 283, 668 [CrossRef] [Google Scholar]
- Duchêne, G., McCabe, C., Pinte, C., et al. 2010, ApJ, 712, 112 [NASA ADS] [CrossRef] [Google Scholar]
- Dutrey, A., Guilloteau, S., Duvert, G., et al. 1996, A&A, 309, 493 [NASA ADS] [Google Scholar]
- Dutrey, A., Guilloteau, S., & Guelin, M. 1997, A&A, 317, L55 [NASA ADS] [Google Scholar]
- Dutrey, A., Guilloteau, S., & Simon, M. 2003, A&A, 402, 1003 [NASA ADS] [CrossRef] [EDP Sciences] [Google Scholar]
- Dutrey, A., Wakelam, V., Boehler, Y., et al. 2011, A&A, 535, A104 [NASA ADS] [CrossRef] [EDP Sciences] [Google Scholar]
- Duvert, G., Dutrey, A., Guilloteau, S., et al. 1998, A&A, 332, 867 [NASA ADS] [Google Scholar]
- Duvert, G., Guilloteau, S., Ménard, F., Simon, M., & Dutrey, A. 2000, A&A, 355, 165 [NASA ADS] [Google Scholar]
- Eislöffel, J., & Mundt, R. 1998, AJ, 115, 1554 [NASA ADS] [CrossRef] [Google Scholar]
- Franciosini, E., Scelsi, L., Pallavicini, R., & Audard, M. 2007, A&A, 471, 951 [NASA ADS] [CrossRef] [EDP Sciences] [Google Scholar]
- Fuente, A., Cernicharo, J., Agúndez, M., et al. 2010, A&A, 524, A19 [NASA ADS] [CrossRef] [EDP Sciences] [Google Scholar]
- Greaves, J. S. 2005, MNRAS, 364, L47 [NASA ADS] [CrossRef] [Google Scholar]
- Guilloteau, S., & Dutrey, A. 1998, A&A, 339, 467 [NASA ADS] [Google Scholar]
- Guilloteau, S., Dutrey, A., & Simon, M. 1999, A&A, 348, 570 [NASA ADS] [Google Scholar]
- Guilloteau, S., Piétu, V., Dutrey, A., & Guélin, M. 2006, A&A, 448, L5 [NASA ADS] [CrossRef] [EDP Sciences] [Google Scholar]
- Guilloteau, S., Dutrey, A., Piétu, V., & Boehler, Y. 2011, A&A, 529, A105 [NASA ADS] [CrossRef] [EDP Sciences] [Google Scholar]
- Hernández, J., Calvet, N., Briceño, C., Hartmann, L., & Berlind, P. 2004, AJ, 127, 1682 [NASA ADS] [CrossRef] [Google Scholar]
- Hirth, G. A., Mundt, R., & Solf, J. 1994, A&A, 285, 929 [NASA ADS] [Google Scholar]
- Horne, K., & Marsh, T. R. 1986, MNRAS, 218, 761 [NASA ADS] [CrossRef] [Google Scholar]
- Hughes, A. M., Wilner, D. J., Andrews, S. M., Qi, C., & Hogerheijde, M. R. 2011, ApJ, 727, 85 [NASA ADS] [CrossRef] [Google Scholar]
- Isella, A., Testi, L., Natta, A., et al. 2007, A&A, 469, 213 [CrossRef] [EDP Sciences] [Google Scholar]
- Isella, A., Carpenter, J. M., & Sargent, A. I. 2010a, ApJ, 714, 1746 [NASA ADS] [CrossRef] [Google Scholar]
- Isella, A., Natta, A., Wilner, D., Carpenter, J. M., & Testi, L. 2010b, ApJ, 725, 1735 [NASA ADS] [CrossRef] [Google Scholar]
- Jonkheid, B., Dullemond, C. P., Hogerheijde, M. R., & van Dishoeck, E. F. 2007, A&A, 463, 203 [NASA ADS] [CrossRef] [EDP Sciences] [Google Scholar]
- Kalugina, Y., Lique, F., & Kłos, J. 2012, MNRAS, 422, 812 [NASA ADS] [CrossRef] [Google Scholar]
- Kenyon, S. J., & Hartmann, L. 1995, ApJS, 101, 117 [NASA ADS] [CrossRef] [Google Scholar]
- Kitamura, Y., Kawabe, R., & Saito, M. 1996, ApJ, 457, 277 [NASA ADS] [CrossRef] [Google Scholar]
- Krist, J. E., Stapelfeldt, K. R., Burrows, C. J., et al. 1998, ApJ, 501, 841 [NASA ADS] [CrossRef] [Google Scholar]
- Launhardt, R., Pavlyuchenkov, Y., Gueth, F., et al. 2009, A&A, 494, 147 [NASA ADS] [CrossRef] [EDP Sciences] [Google Scholar]
- Liu, C.-F., Shang, H., Pyo, T.-S., et al. 2012, ApJ, 749, 62 [NASA ADS] [CrossRef] [Google Scholar]
- Luhman, K. L., Allen, P. R., Espaillat, C., Hartmann, L., & Calvet, N. 2010, ApJS, 186, 111 [NASA ADS] [CrossRef] [Google Scholar]
- McCabe, C., Duchêne, G., Pinte, C., et al. 2011, ApJ, 727, 90 [NASA ADS] [CrossRef] [Google Scholar]
- Meeus, G., Waters, L. B. F. M., Bouwman, J., et al. 2001, A&A, 365, 476 [NASA ADS] [CrossRef] [EDP Sciences] [Google Scholar]
- Mitchell, G. F., Sargent, A. I., & Mannings, V. 1997, ApJ, 483, L127 [NASA ADS] [CrossRef] [Google Scholar]
- Momose, M., Ohashi, N., Kawabe, R., Hayashi, M., & Nakano, T. 1996, ApJ, 470, 1001 [NASA ADS] [CrossRef] [Google Scholar]
- Monin, J.-L., Pudritz, R. E., & Lazareff, B. 1996, A&A, 305, 572 [NASA ADS] [Google Scholar]
- Müller, H. S. P., Thorwirth, S., Roth, D. A., & Winnewisser, G. 2001, A&A, 370, L49 [NASA ADS] [CrossRef] [EDP Sciences] [Google Scholar]
- Nguyen, D. C., Brandeker, A., van Kerkwijk, M. H., & Jayawardhana, R. 2012, ApJ, 745, 119 [Google Scholar]
- Öberg, K. I., Qi, C., Fogel, J. K. J., et al. 2010, ApJ, 720, 480 [NASA ADS] [CrossRef] [Google Scholar]
- Öberg, K. I., Qi, C., Fogel, J. K. J., et al. 2011, ApJ, 734, 98 [NASA ADS] [CrossRef] [Google Scholar]
- Osterloh, M., & Beckwith, S. V. W. 1995, ApJ, 439, 288 [NASA ADS] [CrossRef] [Google Scholar]
- Padgett, D. L., Brandner, W., Stapelfeldt, K. R., et al. 1999, AJ, 117, 1490 [NASA ADS] [CrossRef] [Google Scholar]
- Pety, J., Gueth, F., Guilloteau, S., & Dutrey, A. 2006, A&A, 458, 841 [NASA ADS] [CrossRef] [EDP Sciences] [Google Scholar]
- Piétu, V., Guilloteau, S., & Dutrey, A. 2005, A&A, 443, 945 [NASA ADS] [CrossRef] [EDP Sciences] [Google Scholar]
- Piétu, V., Dutrey, A., & Guilloteau, S. 2007, A&A, 467, 163 [NASA ADS] [CrossRef] [EDP Sciences] [Google Scholar]
- Prato, L., Lockhart, K. E., Johns-Krull, C. M., & Rayner, J. T. 2009, AJ, 137, 3931 [NASA ADS] [CrossRef] [Google Scholar]
- Pyo, T., Kobayashi, N., Hayashi, M., et al. 2003, ApJ, 590, 340 [NASA ADS] [CrossRef] [Google Scholar]
- Qi, C., D’Alessio, P., Öberg, K. I., et al. 2011, ApJ, 740, 84 [NASA ADS] [CrossRef] [Google Scholar]
- Ratzka, T., Schegerer, A. A., Leinert, C., et al. 2009, A&A, 502, 623 [NASA ADS] [CrossRef] [EDP Sciences] [Google Scholar]
- Roccatagliata, V., Ratzka, T., Henning, T., et al. 2011, A&A, 534, A33 [NASA ADS] [CrossRef] [EDP Sciences] [Google Scholar]
- Salter, D. M., Hogerheijde, M. R., van der Burg, R. F. J., Kristensen, L. E., & Brinch, C. 2011, A&A, 536, A80 [NASA ADS] [CrossRef] [EDP Sciences] [Google Scholar]
- Schaefer, G. H., Dutrey, A., Guilloteau, S., Simon, M., & White, R. J. 2009, ApJ, 701, 698 [NASA ADS] [CrossRef] [Google Scholar]
- Schreyer, K., Guilloteau, S., Semenov, D., et al. 2008, A&A, 491, 821 [NASA ADS] [CrossRef] [EDP Sciences] [Google Scholar]
- Semenov, D., & Wiebe, D. 2011, ApJS, 196, 25 [NASA ADS] [CrossRef] [Google Scholar]
- Simon, M., Dutrey, A., & Guilloteau, S. 2000, ApJ, 545, 1034 [NASA ADS] [CrossRef] [Google Scholar]
- Skatrud, D. D., de Lucia, F. C., Blake, G. A., & Sastry, K. V. L. N. 1983, J. Mol. Spectr., 99, 35 [Google Scholar]
- Tafalla, M., Santiago-García, J., Hacar, A., & Bachiller, R. 2010, A&A, 522, A91 [NASA ADS] [CrossRef] [EDP Sciences] [Google Scholar]
- Testi, L., Bacciotti, F., Sargent, A. I., Ray, T. P., & Eislöffel, J. 2002, A&A, 394, L31 [NASA ADS] [CrossRef] [EDP Sciences] [Google Scholar]
- Thi, W.-F., van Zadelhoff, G.-J., & van Dishoeck, E. F. 2004, A&A, 425, 955 [NASA ADS] [CrossRef] [EDP Sciences] [Google Scholar]
- Tilling, I., Woitke, P., Meeus, G., et al. 2012, A&A, 538, A20 [NASA ADS] [CrossRef] [EDP Sciences] [Google Scholar]
- Troscompt, N., Faure, A., Wiesenfeld, L., Ceccarelli, C., & Valiron, P. 2009, A&A, 493, 687 [NASA ADS] [CrossRef] [EDP Sciences] [Google Scholar]
- van den Ancker, M. E., de Winter, D., & Tjin A Djie, H. R. E. 1998, A&A, 330, 145 [NASA ADS] [Google Scholar]
- van Leeuwen, F. 2007, A&A, 474, 653 [NASA ADS] [CrossRef] [EDP Sciences] [Google Scholar]
- White, R. J., & Basri, G. 2003, ApJ, 582, 1109 [NASA ADS] [CrossRef] [Google Scholar]
- White, R. J., & Ghez, A. M. 2001, ApJ, 556, 265 [Google Scholar]
- White, R. J., & Hillenbrand, L. A. 2004, ApJ, 616, 998 [NASA ADS] [CrossRef] [Google Scholar]
- Wilking, B. A., Marvel, K. B., Claussen, M. J., et al. 2012, ApJ, 753, 143 [NASA ADS] [CrossRef] [Google Scholar]
- Wolf, S., Padgett, D. L., & Stapelfeldt, K. R. 2003, ApJ, 588, 373 [NASA ADS] [CrossRef] [Google Scholar]
- Yokogawa, S., Kitamura, Y., Momose, M., & Kawabe, R. 2002, in 8th Asian-Pacific Regional Meeting, Volume II, eds. S. Ikeuchi, J. Hearnshaw, & T. Hanawa, 239 [Google Scholar]
All Tables
All Figures
|
Fig. 1 Spectra of the observed transitions towards Haro 6-10. Top panel: 13CO J = 2−1 spectrum. Bottom panels, from top to bottom: spectra of 13CO J = 2−1, C17O J = 2−1, CN N = 2−1, ortho H2CO 313 − 212, ortho H2CO 312 − 211, and SO 54 − 43 presented on a common scale. The Y axis scale is antenna temperature, |
| In the text | |
|
Fig. 2 As Fig. 1 but towards MWC 480. The red curve is a simple Gaussian fit to the disk emission in 13CO J = 2−1. |
| In the text | |
|
Fig. 3 Integrated line flux of the 312 − 211 line of H2CO vs that of the 313 − 212 transition. Color codes indicate detected vs. non-detected lines: blue for detection of both lines, black for detection of the 313 − 212 line, green for non detections. The detection threshold is set at 4σ. For detected lines, the errorbars are 1σ. For non-detected lines, the limit is the 2σ value, and the arrow length is 1σ. Sources in italics are those with known molecular outflows. |
| In the text | |
|
Fig. 4 Integrated line flux of H2CO (combination of both transitions) vs. CN N = 2−1 (main group of hyperfine components). Color codes indicate detected vs. non-detected lines: blue for detection of both lines, red for detection of the x-axis line only (here CN), black for detection of the y-axis line only (here H2CO), and green for non detections. The detection threshold is set at 3σ. For detected lines, the errorbars are 1σ. For non-detected lines, the limit is the 2σ value (best fit + 2σ), and the arrow length is 1σ. Sources in italics are those with known molecular outflows. |
| In the text | |
|
Fig. 5 As for Fig. 4 but for 13CO J = 2−1 (including contribution from the cloud) vs. CN N = 2−1. T Tau is out of scale here. |
| In the text | |
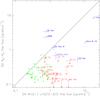 |
Fig. 6 As for Fig. 4 but for SO vs. CN N = 2−1. |
| In the text | |
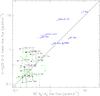 |
Fig. 7 As for Fig. 4 but for H2CO vs. SO. |
| In the text | |
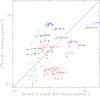 |
Fig. 8 As for Fig. 4 but for C17O J = 2−1 vs. CN N = 2−1. |
| In the text | |
|
Fig. 9 As for Fig. 4 but for 13CO (disk component only) vs. CN. The dashed lines indicate a factor 2 between the two line fluxes. |
| In the text | |
|
Fig. 10 Hyperfine components of CN in bright, potentially thick sources. The best fit with the hyperfine components is overlaid. The intensity scale is |
| In the text | |
|
Fig. 11 CN line width (km s-1) as a function of disk inclination. Sources with unknown inclinations are in blue: we used i = 60° as the most likely value. Sources with outflows were excluded. |
| In the text | |
|
Fig. 12 Correlation between CN line flux (main fine structure group, in Jy km s-1) and stellar spectral type. Blue is for detected sources, red for upper limits. Sources with outflows were excluded. Emission in AB Aur is from the envelope. |
| In the text | |
|
Fig. 13 As Fig. 12, but for CN line flux (main fine structure group) vs. 1.3 mm continuum flux (in mJy). |
| In the text | |
|
Fig. 14 Correlation between the H2CO to CN flux ratio and stellar spectral type. Red indicates upper limits (no H2CO), black lower limits (no CN). H2CO in FN Tau and CIDA 8 is likely to be cloud contamination. Outflow sources are in italics. |
| In the text | |
|
Fig. 15 Histogram of detections as a function of 1.3 mm continuum flux range. Filled: disks, hatched: outflow contaminated sources, empty: non detections. |
| In the text | |
|
Fig. B.1 Spectra of the observed transitions towards FN Tau. |
| In the text | |
|
Fig. B.2 Spectra of the observed transitions towards CW Tau. |
| In the text | |
|
Fig. B.3 Spectra of the observed transitions towards CIDA-1. |
| In the text | |
|
Fig. B.4 Spectra of the observed transitions towards BP Tau. |
| In the text | |
|
Fig. B.5 Spectra of the observed transitions towards DE Tau. |
| In the text | |
|
Fig. B.6 Spectra of the observed transitions towards RY Tau. |
| In the text | |
|
Fig. B.7 Spectra of the observed transitions towards T Tau. |
| In the text | |
|
Fig. B.8 Spectra of the observed transitions towards Haro 6-5 B. |
| In the text | |
|
Fig. B.9 Spectra of the observed transitions towards FT Tau. |
| In the text | |
|
Fig. B.10 Spectra of the observed transitions towards DG Tau B. |
| In the text | |
|
Fig. B.11 Spectra of the observed transitions towards DG Tau. |
| In the text | |
|
Fig. B.12 Spectra of the observed transitions towards Haro 6-10. |
| In the text | |
|
Fig. B.13 Spectra of the observed transitions towards IQ Tau. |
| In the text | |
|
Fig. B.14 Spectra of the observed transitions towards LkHa 358. |
| In the text | |
|
Fig. B.15 Spectra of the observed transitions towards HH 30. |
| In the text | |
|
Fig. B.16 Spectra of the observed transitions towards HL Tau. |
| In the text | |
|
Fig. B.17 Spectra of the observed transitions towards HK Tau. |
| In the text | |
|
Fig. B.18 Spectra of the observed transitions towards Haro 6-13. |
| In the text | |
|
Fig. B.19 Spectra of the observed transitions towards GG Tau. |
| In the text | |
|
Fig. B.20 Spectra of the observed transitions towards UZ Tau E. |
| In the text | |
|
Fig. B.21 Spectra of the observed transitions towards 04302+2247. |
| In the text | |
|
Fig. B.22 Spectra of the observed transitions towards DL Tau. |
| In the text | |
|
Fig. B.23 Spectra of the observed transitions towards AA Tau. |
| In the text | |
|
Fig. B.24 Spectra of the observed transitions towards DN Tau. |
| In the text | |
|
Fig. B.25 Spectra of the observed transitions towards DO Tau. |
| In the text | |
|
Fig. B.26 Spectra of the observed transitions towards HV Tau C. |
| In the text | |
|
Fig. B.27 Spectra of the observed transitions towards Haro 6-33. |
| In the text | |
|
Fig. B.28 Spectra of the observed transitions towards DQ Tau. |
| In the text | |
|
Fig. B.29 Spectra of the observed transitions towards DR Tau. |
| In the text | |
|
Fig. B.30 Spectra of the observed transitions towards DS Tau. |
| In the text | |
|
Fig. B.31 Spectra of the observed transitions towards UY Aur. |
| In the text | |
|
Fig. B.32 Spectra of the observed transitions towards AB Aur. |
| In the text | |
|
Fig. B.33 Spectra of the observed transitions towards SU Aur. |
| In the text | |
|
Fig. B.34 Spectra of the observed transitions towards MWC 480. |
| In the text | |
|
Fig. B.35 Spectra of the observed transitions towards CB 26. |
| In the text | |
|
Fig. B.36 Spectra of the observed transitions towards CIDA-8. |
| In the text | |
|
Fig. B.37 Spectra of the observed transitions towards CIDA-11. |
| In the text | |
|
Fig. B.38 Spectra of the observed transitions towards RW Aur. |
| In the text | |
|
Fig. B.39 Spectra of the observed transitions towards MWC 758. |
| In the text | |
|
Fig. B.40 Spectra of the observed transitions towards CQ Tau. |
| In the text | |
|
Fig. B.41 Spectra of the observed transitions towards DM Tau. |
| In the text | |
|
Fig. B.42 Spectra of the observed transitions towards HD 163296. The observed SO transition is not the same as in all other sources. |
| In the text | |
|
Fig. C.1 Spectra of CN towards CW Tau. The best fit with the hyperfine components is drawn below. The upper profile indicates the expected profile for an optically thin line. Detection of even weak components suggests high optical depth (~20−30). The intensity scale is |
| In the text | |
|
Fig. D.1 Regions of the disk which yield equal projected velocities vobs. The ellipse is the projection of the disk outer edge observed with an inclination of 45°. |
| In the text | |
Current usage metrics show cumulative count of Article Views (full-text article views including HTML views, PDF and ePub downloads, according to the available data) and Abstracts Views on Vision4Press platform.
Data correspond to usage on the plateform after 2015. The current usage metrics is available 48-96 hours after online publication and is updated daily on week days.
Initial download of the metrics may take a while.