| Issue |
A&A
Volume 549, January 2013
|
|
|---|---|---|
| Article Number | A92 | |
| Number of page(s) | 31 | |
| Section | Interstellar and circumstellar matter | |
| DOI | https://doi.org/10.1051/0004-6361/201220298 | |
| Published online | 03 January 2013 | |
Online material
Appendix A: Comments on individual sources
-
FN Tau: the tentative detection of H2CO is at an unusual velocity of −0.5 km s-1.
-
CW Tau is dominated by confusion (see discussion in Appendix C). Despite strong confusion, line wings of 13CO could indicate a disk at velocity 6.2 km s-1 and with a line width of 3.3 ± 0.4 km s-1. CW Tau drives a bipolar outflow that can be traced in optical forbidden lines over 4″−6″ along both outflow directions (Hirth et al. 1994).
-
CIDA 1 (Briceno et al. 1993) is a late spectral type object (M5.5 White & Basri 2003), with weak 1.3 mm continuum emission (Schaefer et al. 2009). The line of sight towards CIDA 1 intercepts the same molecular cloud than that of CW Tau and is highly confused. The tentative fit of the 13CO line wing is not conclusive on the presence of a disk.
-
BP Tau harbors a small (120 AU radius) disk (Dutrey et al. 2003) and strong confusion in 12CO. No signal at all is detected in these new observations, but the sensitivity towards this source is lower than average.
-
DE Tau has relatively weak 1.3 mm continuum (36 mJy). There is some confusion in 13CO, but no evidence for disk emission.
-
RY Tau: the CN detection is marginal (3.5σ). A fit of a 3 km s-1 wide Gaussian to the 13CO spectrum also indicate a potential disk, at the 5σ level, but with a different velocity. RY Tau is a suspected close binary, with separation >3 AU (Bertout et al. 1999). Velocity measurements by Nguyen et al. (2012) indicate a possible SB1 with radial heliocentric velocity in the range 16.7−19.4 km s-1, which is equivalent to 7.7−10.4 km s-1 in the LSR, and more consistent with the 13CO velocity. High resolution image at 1.3 mm by Isella et al. (2010a) indicate an inclination of 66° and a morphology consistent with a deficit of emission in the inner 15 AU.
-
T Tau is a triple system, with a compact (~60 AU) circumstellar disk around the single T Tau N (Akeson et al. 1998; Guilloteau et al. 2011). Its molecular environment is complex, and all the detected lines are most likely coming from an outflow or heated envelope, perhaps the outflowing cavity walls imaged in 13CO by Momose et al. (1996).
-
Haro 6-5 B, also known as FS Tau B, is a nearly edge-on, deeply embedded object. Confusion in 13CO is very strong. Previous interferometric measurements of 13CO J = 1−0 revealed a complex region (Dutrey et al. 1996). HST images indicate a 300 AU radius disk at high inclination, 70−80° (Krist et al. 1998; Padgett et al. 1999). FS Tau B possess a jet and a counterjet, as well as an optically visible cavity wall (Liu et al. 2012). Our combined detection of CN and H2CO may indicate a compact, warm disk or some emission from an outflow or envelope. 5′′ resolution images in 13CO J = 1−0 with the NMA (Yokogawa et al. 2002) revealed a disk at VLSR ≈ 7.0 km s-1, with a kinematics dominated by rotation. They indicate motions compatible with Keplerian motions around a central star of 0.25 M⊙ only. Given the high confusion level, this value may be unreliable. Our CN line width, though unprecise, suggests a higher stellar mass. The asymmetric H2CO spectrum may be affected by confusion in the blueshifted part.
-
FT Tau is a deeply embedded, low luminosity star with unknown spectral type. A compact (60 AU) dust disk was resolved by Guilloteau et al. (2011), who also detected 12CO emission, suggesting a small disk at low inclination around a 0.7−1.0 M⊙ star. The clear detection of CN confirms the disk interpretation. 13CO emission from the disk may be present at redshifted velocities compatible with CN, but confusion makes any quantitative estimate impossible.
-
DG Tau is a well studied object, driving an optical microjet. The system inclination remain unclear: between 38 and 45° from the jet (Pyo et al. 2003; Eislöffel & Mundt 1998), and 20 to 32° from the dust disk (Isella et al. 2010a; Guilloteau et al. 2011). Images in 13CO (2−1) (Testi et al. 2002) indicate a complex morphology, a large fraction of the emission coming from a remnant envelope (see also Kitamura et al. 1996). There is no clear evidence for Keplerian rotation. The relatively narrow lines of H2CO and SO could originate from this remnant envelope. CN(2−1) was previously detected by Salter et al. (2011)5, who modeled this as coming from a Keplerian disk. Our CN line width is consistent with the measurement of Salter et al. (2011), but the large derived outer radius, combined with the complex morphology, suggests CN is most likely coming from the outflow or the remnant envelope.
-
DG Tau B is a totally obscured object, driving a powerful one-sided molecular outflow (Mitchell et al. 1997). High inclination (64−75°, see Guilloteau et al. 2011; Eislöffel & Mundt 1998) however yield moderate line-of-sight velocities for the outflow. The rich spectrum may originate from the outflow, but CN lacks the narrow component detected in H2CO and C17O, which is presumably due to the molecular cloud.
-
Haro 6-10 (also known as GV Tau) is a close binary, with two compact (<30 AU), optically thick, circumstellar disks (Guilloteau et al. 2011), but no known circumbinary disk. The circumstellar disks are misaligned and the system is embedded in a common envelope (Roccatagliata et al. 2011). H2O maser emission has been recently reported, and suggest that the Southern component is itself a close binary (Wilking et al. 2012). As for DG Tau B, the CN line is much wider than those of H2CO and C17O. The proeminent red wing in 13CO is likely to trace the outflow.
-
IQ Tau was observed in 12CO by Schaefer et al. (2009), who did not detect any significant emission with the IRAM Plateau de Bure interferometer at 5′′ resolution. The CN emission exhibits the clear signature of Keplerian rotation (although the expected double peaked aspect is reduced because of the hyperfine component blending). CN is apparently stronger than 13CO in this source. A tentative fit of a disk component to the 13CO spectrum suggest the redshifted emission may still be masked by the cloud.
-
LkHa 358: 13CO is heavily confused. A small molecular disk was reported from interferometric measurements by Schaefer et al. (2009) from 12CO emission. An attempt to fit a disk component to the 13CO line wings is consistent with this interpretation, provided 13CO has significant optical depth (>2 on average). The narrow emission from C17O most likely comes from the surrounding cloud, as the ~3.5σ signal from H2CO.
-
HH 30: Pety et al. (2006) had previously imaged the 13CO emission from this emblematic edge-on object. The narrow line from C17O likely comes from the cloud, as the ~3σ signal from H2CO.
-
HL Tau is the archetype of the deeply embedded, outflow driving sources. The redshifted side of the outflow is known to be brighter (Cabrit et al. 1996; Monin et al. 1996). From the line profiles, C17O, H2CO and especially SO (which is significantly redshifted), must come from the outflow. However, the CN line is much narrower and exhibit a systemic velocity of 4.7 km s-1, and thus could be a pure disk tracer.
-
HK Tau is a binary star, with one component exhibiting an edge-on disk (McCabe et al. 2011). The relatively broad CN line is consistent with emission from this edge-on disk around HK Tau B. The blue shifted side of the disk may also have been detected in 13CO.
-
Haro 6-13, also known as V 806 Tau, was imaged in 12CO by Schaefer et al. (2009), who based on agreement in position angle between CO and dust emission, attributed the emission to a disk of at least 180 AU radius. HCO+3–2 emission has been detected by Salter et al. (2011). The H2CO spectra are complex, as the C17O one, and perhaps result of superposition of relatively broad emission with a narrow (0.5 km s-1) absorption feature.
-
GG Tau was included as a reference source in our sample. Our results agree with the initial detections of Dutrey et al. (1997). H2CO is well detected in the combined spectrum.
-
UZ Tau E is a spectroscopic binary part of the UZ Tau hierarchical quadruple system. The CO disk was detected by Simon et al. (2000), who found an inclination of 55° and an outer radius of 300 AU. Our derived radius from CN is in excellent agreement with this value. 13CO emission from the disk is also detected, in the line wings, but still exhibits confusion.
-
IRAS 04302+2247 (the Butterfly star Wolf et al. 2003), is an edge-on system. Recent IRAM interferometric measurements indicate a stellar mass of order 1.6 M⊙ and a disk radius of 260 AU (Dutrey et al., in prep.). Although this source exhibits a large H2CO/CN ratio, which we in general attribute to outflows, the H2CO and SO emissions come from the disk. From the hyperfine ratios, CN appears potentially optically thick in this source, in which case the emission must be dominated by smaller radii. The rather large linewidth concurs with this interpretation.
-
DL Tau was imaged in 12CO by Simon et al. (2000) who pointed out the strong confusion making the inclination derivation unreliable. Confusion is also large in 13CO, masking all the emission except for the red-shifted wing. Like IQ Tau, DL Tau shows strong, double peaked line profile in CN. The outer radius derived from CN is consistent with the value quoted by Simon et al. (2000) for CO. H2CO is also detected.
-
AA Tau: CN is clearly detected, and weak emission is also visible in 13CO, despite confusion. However, the disk contribution in 13CO is much smaller than the intensity reported by Greaves (2005) (0.6 K km s-1 at JCMT, i.e. 12 Jy km s-1), which must have included cloud emission. CN in AA Tau was discovered by Öberg et al. (2010). We recover only about half of their quoted flux (1.7 Jy km s-1), and our derived velocity suggests that the blue-shifted part of the CN spectrum is masked by confusion, like the 13CO one.
-
DN Tau is very similar to DL Tau and IQ Tau, with CN stronger than 13CO. Schaefer et al. (2009) failed to detect 12CO from this object with the IRAM interferometer, again presumably because of strong confusion with the cloud.
-
DO Tau shows clear CN detection (4σ), but the line width is poorly constrained. The line can be narrow, so (positive) contamination by the cloud is not fully excluded. Identification of a disk component in 13CO is difficult, as the redshifted side is dominated by the cloud.
-
HV Tau C, like HK Tau B, is a compact (80 AU radius) edge on disk in a multiple system, here a hierarchical triple. 12CO emission from the disk was resolved by Duchêne et al. (2010) with the IRAM array. The broad CN line (ΔV = 6 km s-1) is consistent with an origin in a compact disk. The CN flux suggests a somewhat larger radius (300 AU in Table 5), or equivalently, non negligible optical depth. The observed hyperfine ratios are indeed compatible with substantial optical depth, τ = 7.0 ± 2.7, which would also yield a lower line width, 4.2 ± 0.6 km s-1. 13CO emission from the disk produces the line wings visible in Fig. B.26
-
Haro 6-33 (also known as IRAS 04385+2550) was detected in 12CO by Schaefer et al. (2009), who interpreted the emission as coming from a Keplerian disk, despite strong confusion. There is also substantial cloud contamination in 13CO, but CN and H2CO are detected. The derived disk radius in CN is in good agreement with the 12CO result.
-
DQ Tau exhibits huge confusion, and no detection at all.
-
DR Tau was reported as tentatively detected in CN(2−1) by Salter et al. (2011) at a velocity of 11 km s-1 with an integrated flux of 3.5 ± 1.3 Jy km s-1. Our spectrum shows no line at all, with a 3σ upper limit on the flux of 1.4 Jy km s-1. Confusion with the cloud is huge in 13CO: only the red wing between 10 and 11 km s-1 may be attributable to a disk component.
-
DS Tau shows no apparent confusion. A weak (4σ) line is detected when combining both o-H2CO transitions, with a velocity (6.0 km s-1) and linewidth (3 km s-1) consistent with disk emission, but no CN or 13CO.
-
UY Aur is a 0.8′′ separation binary system. The 13CO line is strong, and consistent with an origin in the complex circumbinary structure imaged by Duvert et al. (2000). There is a 4σ detection of H2CO with a compatible kinematics.
-
AB Aur: the strong 13CO line emanates from a combination of the disk/ring structure imaged by Piétu et al. (2005) and the surrounding envelope. The clear detection of C17O confirms the large CO content of this source. H2CO is convincingly detected, confirming the result of Fuente et al. (2010) using the para-H2CO 30,3 − 20,2 line at 218.2 GHz. However, we find no evidence at all for CN or SO from the disk, which were claimed to be detected by these authors. We only have a narrow (0.4 km s-1), 3.5σ feature in CN(2−1) at a velocity consistent with cloud emission. The CN (1−0) line quoted by Fuente et al. (2010) must have been residual emission from the cloud. For SO, they report a line intensity of 26 mK km s-1 for the 34 − 23 line, and 60 mK km s-1 for the 56 − 45 transitions, while we obtain a 3σ upper limit of 21 mK km s-1 for the 54 − 43 using the AB Aur velocity and line widths. Note that Fuente et al. (2010) used a larger throw (120′′) than us in the wobbler switching, so that their results are more susceptible to residual emission from the envelope.
-
SU Aur: despite confusion with the cloud, the 13CO spectrum exhibits a broad component compatible with emission from a disk. No other molecule is detected. SU Aur is a strong X-ray source (Franciosini et al. 2007). Near IR imaging indicates a highly inclined disk (≃ 65°) and outflow cavity walls (Akeson et al. 2002; Chakraborty & Ge 2004).
-
MWC 480 was included here as a reference source in our sample. It has been extensively studied with the IRAM mm array (Piétu et al. 2007; Chapillon et al. 2012). We find the double peaked 13CO profile characteristic of an isolated Keplerian disk. CN emission is in excellent agreement with the interferometric results of Chapillon et al. (2012). The detection of C17O for the first time in this source confirms the significant CO abundance in this object. Note that, as expected, the C17O profile is apparently larger than the 13CO one.
-
CB26 is a deeply embedded, edge-on object driving an unusual outflow (Launhardt et al. 2009) in an isolated Bok globule. Like in HL Tau, we detect here strong H2CO and SO emission, but only a weak CN line. If interpreted by disk emission, the CN line is consistent with a disk size about 250 AU.
-
CIDA 8 has weak continuum emission and no CO disk from interferometric measurements of Schaefer et al. (2009). Cloud contamination exists, but appears limited to a very narrow velocity range. There is a surprising detection of H2CO just outside the range visibly contaminated in 13CO, but with a narrow line width which suggests it originates from a cloud.
-
CIDA 11 shows no detection at all. It was also not detected in continuum and CO by Schaefer et al. (2009).
-
RW Aur is a binary system that was imaged in 12CO by Cabrit et al. (2006), who find evidence for a very small (50 AU radius) disk, but did not detect 13CO emission. Our negative result is consistent with their findings.
-
MWC 758 is a 1.8 M⊙ star surrounded by a disk where CO is apparently depleted and mostly optically thin (Chapillon et al. 2008), despite high temperatures (30 K). We find a relatively weak line of 13CO, consistent with this interpretation. No other molecule is detected: the marginal signal in C17O is not at the expected disk velocity. The limited CO opacity could be related to the large cavity detected by Isella et al. (2010b) in continuum.
-
CQ Tau is a “twin” of MWC 758, also exhibiting a warm (>50 K) disk with optically thin CO emission (Chapillon et al. 2008), but its continuum emission is strongly centrally peaked (Banzatti et al. 2011; Guilloteau et al. 2011). Although different distances are often quoted based on Hipparcos parallax, these differences are not significant and Chapillon et al. (2008) argue that both CQ Tau and MWC 758 are also located at 140 pc. We also detect 13CO with a similar intensity than in MWC 758. H2CO is detected at the 5σ level, with kinematic parameters quite consistent with those derived from 13CO. However, we find no evidence for CN. Our 3σ limit of 0.28 Jy km s-1 is marginally consistent with the flux of 0.22 ± 0.11 Jy km s-1 reported by Öberg et al. (2010).
-
HD 163296 is an isolated Herbig Ae star located at 120 pc (van Leeuwen 2007). It harbours a large (~550 AU) CO disk inclined at about 45° (Isella et al. 2007), and has been extensively studied in CO isotopologues, including C17O (Qi et al. 2011). CN N = 3−2 was detected by Thi et al. (2004). The strong CN N = 2−1 emission is compatible with an optically thin line. The outer radius in Table 5 is slightly larger than that measured from CO. The discrepancy may have several origins. First, as the star is very luminous, CN may be in a warmer region. Second, Hughes et al. (2011) report a rather large turbulence level (≃ 0.3 km s-1) from CO measurements, larger than assumed. We also report the first detection of H2CO, through the ortho-H2CO 313 − 212 transition. Comparison of our 13CO spectrum to the interferometric result of Qi et al. (2011) suggest some contamination near 2−4 km s-1 (and also 13 km s-1 as in the 12CO spectra of Qi et al. 2011).
Appendix B: Spectra for individual sources
This appendix displays the spectra towards the various sources. For each source, the top panel shows the 13CO J = 2−1 spectrum. The continuous red line, if present, is a Gaussian fit obtained after masking the confused velocity range. The bottom panel displays on a common scale from top to bottom the spectra of: 13CO J = 2−1 (with fit as in top panel), C17O J = 2−1, CN N = 2−1, ortho H2CO 313 − 212, ortho H2CO 312 − 211, the average of both o-H2CO transitions, and SO 54 − 43, arbitrarily shifted in intensity to avoid overlap. The intensity scale is antenna temperature ( in K): conversion to flux density can be obtained using a factor of 9 Jy/K.
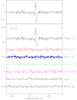 |
Fig. B.1
Spectra of the observed transitions towards FN Tau. |
| Open with DEXTER | |
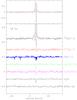 |
Fig. B.2
Spectra of the observed transitions towards CW Tau. |
| Open with DEXTER | |
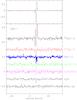 |
Fig. B.3
Spectra of the observed transitions towards CIDA-1. |
| Open with DEXTER | |
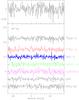 |
Fig. B.4
Spectra of the observed transitions towards BP Tau. |
| Open with DEXTER | |
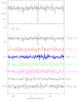 |
Fig. B.5
Spectra of the observed transitions towards DE Tau. |
| Open with DEXTER | |
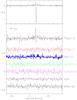 |
Fig. B.6
Spectra of the observed transitions towards RY Tau. |
| Open with DEXTER | |
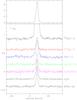 |
Fig. B.7
Spectra of the observed transitions towards T Tau. |
| Open with DEXTER | |
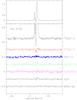 |
Fig. B.8
Spectra of the observed transitions towards Haro 6-5 B. |
| Open with DEXTER | |
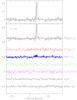 |
Fig. B.9
Spectra of the observed transitions towards FT Tau. |
| Open with DEXTER | |
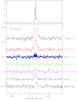 |
Fig. B.10
Spectra of the observed transitions towards DG Tau B. |
| Open with DEXTER | |
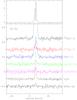 |
Fig. B.11
Spectra of the observed transitions towards DG Tau. |
| Open with DEXTER | |
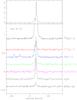 |
Fig. B.12
Spectra of the observed transitions towards Haro 6-10. |
| Open with DEXTER | |
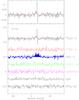 |
Fig. B.13
Spectra of the observed transitions towards IQ Tau. |
| Open with DEXTER | |
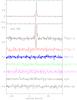 |
Fig. B.14
Spectra of the observed transitions towards LkHa 358. |
| Open with DEXTER | |
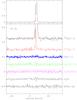 |
Fig. B.15
Spectra of the observed transitions towards HH 30. |
| Open with DEXTER | |
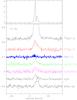 |
Fig. B.16
Spectra of the observed transitions towards HL Tau. |
| Open with DEXTER | |
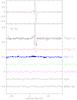 |
Fig. B.17
Spectra of the observed transitions towards HK Tau. |
| Open with DEXTER | |
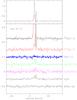 |
Fig. B.18
Spectra of the observed transitions towards Haro 6-13. |
| Open with DEXTER | |
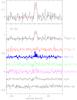 |
Fig. B.19
Spectra of the observed transitions towards GG Tau. |
| Open with DEXTER | |
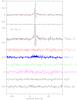 |
Fig. B.20
Spectra of the observed transitions towards UZ Tau E. |
| Open with DEXTER | |
 |
Fig. B.21
Spectra of the observed transitions towards 04302+2247. |
| Open with DEXTER | |
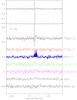 |
Fig. B.22
Spectra of the observed transitions towards DL Tau. |
| Open with DEXTER | |
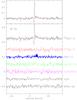 |
Fig. B.23
Spectra of the observed transitions towards AA Tau. |
| Open with DEXTER | |
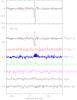 |
Fig. B.24
Spectra of the observed transitions towards DN Tau. |
| Open with DEXTER | |
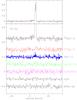 |
Fig. B.25
Spectra of the observed transitions towards DO Tau. |
| Open with DEXTER | |
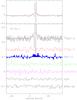 |
Fig. B.26
Spectra of the observed transitions towards HV Tau C. |
| Open with DEXTER | |
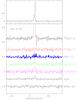 |
Fig. B.27
Spectra of the observed transitions towards Haro 6-33. |
| Open with DEXTER | |
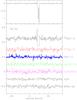 |
Fig. B.28
Spectra of the observed transitions towards DQ Tau. |
| Open with DEXTER | |
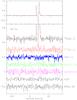 |
Fig. B.29
Spectra of the observed transitions towards DR Tau. |
| Open with DEXTER | |
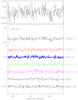 |
Fig. B.30
Spectra of the observed transitions towards DS Tau. |
| Open with DEXTER | |
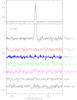 |
Fig. B.31
Spectra of the observed transitions towards UY Aur. |
| Open with DEXTER | |
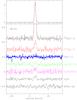 |
Fig. B.32
Spectra of the observed transitions towards AB Aur. |
| Open with DEXTER | |
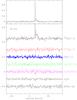 |
Fig. B.33
Spectra of the observed transitions towards SU Aur. |
| Open with DEXTER | |
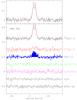 |
Fig. B.34
Spectra of the observed transitions towards MWC 480. |
| Open with DEXTER | |
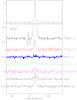 |
Fig. B.35
Spectra of the observed transitions towards CB 26. |
| Open with DEXTER | |
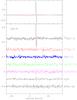 |
Fig. B.36
Spectra of the observed transitions towards CIDA-8. |
| Open with DEXTER | |
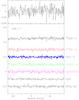 |
Fig. B.37
Spectra of the observed transitions towards CIDA-11. |
| Open with DEXTER | |
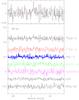 |
Fig. B.38
Spectra of the observed transitions towards RW Aur. |
| Open with DEXTER | |
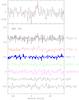 |
Fig. B.39
Spectra of the observed transitions towards MWC 758. |
| Open with DEXTER | |
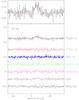 |
Fig. B.40
Spectra of the observed transitions towards CQ Tau. |
| Open with DEXTER | |
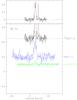 |
Fig. B.41
Spectra of the observed transitions towards DM Tau. |
| Open with DEXTER | |
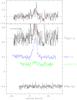 |
Fig. B.42
Spectra of the observed transitions towards HD 163296. The observed SO transition is not the same as in all other sources. |
| Open with DEXTER | |
Appendix C: The CW Tau/CIDA-1 line of sight
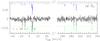 |
Fig. C.1
Spectra of CN towards CW Tau. The best fit with the hyperfine components is drawn below. The upper profile indicates the expected profile for an optically thin line. Detection of even weak components suggests high optical depth (~20−30). The intensity scale is |
| Open with DEXTER | |
CW Tau and CIDA-1, which are only separated by 1 arcmin, exhibit strong confusion in 13CO, and are the only sources in which confusion in CN is obvious. Confusion is also visible in H2CO and even C17O. In addition, in the Salter et al. (2011) study, CW Tau is the source which has extended HCO+ (3−2) emission.
In the beam-switched observations, the detection of hyperfine components of CN (Fig. C.1) suggests significant optical depth. Optically thick CN from clouds could introduce difficulties in using CN as a kinematical disk tracer, as it could absorb the disk emission. This potential problem is mitigated by several independent arguments. First, the cloud line width is small, so only a small fraction of disk kinematics will be affected. Second, CN has several hyperfine components, of very different opacities: this would help in modeling the absorption layer. Furthermore, anomalously high (τ ≫ 1) apparent opacities can be the result of opacity gradients in a cloud with more moderate (τ > 1) average opacity, as the strongest lines saturate first. However, observations of the CW Tau line of sight in frequency switching shows a flat-topped, 2 K line of 13CO, with a line width of 1.40 km s-1 and the same velocity than the CN signal, but no significant CN emission at a level of 50 mK (3σ). Thus, in the beam-switched observations, the detected signal probably originates from emission in one or both of the reference beams, and in the cloud, CN is most likely not much excited. Although high opacities cannot be excluded, the unusual hyperfine line ratios may also be related to weak excitation-dependent anomalies, since CN collision rates display significant dependencies on the hyperfine levels (Kalugina et al. 2012). Non negligible opacities, low excitation and possible hyperfine anomalies have already been reported for CN in dark clouds by Crutcher et al. (1984).
Appendix D: Formation of lines in Keplerian disks
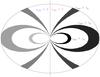 |
Fig. D.1
Regions of the disk which yield equal projected velocities vobs. The ellipse is the projection of the disk outer edge observed with an inclination of 45°. |
| Open with DEXTER | |
Line formation in a Keplerian disk is strongly constrained by the velocity gradient (Horne & Marsh 1986). We use here this property to explore to what extent the detected CN lines trace the (putative) circumstellar disks. Unless the disk is seen face on, only a fraction of the disk projects at any given velocity. This fraction can be estimated with simple reasoning: we follow here the derivation presented by Guilloteau et al. (2006). r,θ being the cylindrical coordinates in the disk plane, the line of sight velocity (in the system rest frame) is 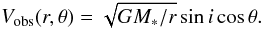 (D.1)The locii of isovelocity are given by
  (D.2)with a finite local line width Δv (assuming rectangular line shape for simplification), the line at a given velocity Vobs originates from a region included between ri(θ) and rs(θ):
  Figure D.1 indicates the regions of equal projected velocities for 6 different values: Vobs > vd, Vobs = vd, Vobs < vd, and their symmetric counterpart at negative velocities, where vd:
  (D.5)\newpage
is the projected velocity at the outer disk radius Rout. Figure D.1 shows that the fraction of the disk covered by the gas at velocities Vobs ≃ vd is of order Δv/vd, and drops very rapidly for larger velocities. The larger area covered for Vobs ≃ vd explains the classical double peaked line profiles emerging from Keplerian disks.
For moderately inclined (i < 70°) disks in Keplerian rotation, the integrated line flux is given by  (D.6)where T0 is the disk temperature (assumed uniform for simplicity), ΔV the local linewidth, Rout the disk outer radius, D is the source distance and i the disk inclination. ρ is a factor of order of the line of sight τl for optically thin lines, saturating as ∝ log (τl) for large optical depths (see Guilloteau & Dutrey 1998, their Fig. 4). The optically thick limit is obtained because of the Keplerian shears which, as demonstrated above, limits the maximum fraction of the disk covered at any velocity to δV/vd. δV is the local linewidth including opacity broadening, so δV ~ log (τl)ΔV for large opacities.
Note that as τl ≃ τp/cos(i), where τp is the line opacity perpendicular to the disk plane, and since τp ∝ Σ/ΔV, where σ is the molecule surface density, the (apparent) dependence on inclination and line width disappears for optically thin lines: the integrated line flux scales as the number of molecules.
From Eq. (D.6), we can derive the outer radius of the molecule distribution provided with have an estimate of ρ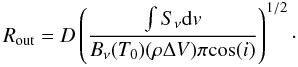 (D.7)Equation (D.7) is valid for single lines. For molecules with hyperfine structure like CN, line blending must be accounted for. We do so in taking into account the relative weight of the hyperfine components: the integrated flux of the J = 5/2−3/2 fine structure group presented in Table 3 is multiplied by 0.45 to obtain the flux in the strongest hyperfine component, which then used in Eq. (D.7) to derive the outer radius. The fitted opacity, if available, is used to provide an estimate of ρ (ρ = τ, τ being the sum of the opacities of all hyperfine components), which is otherwise set to 0.3.
© ESO, 2013
Current usage metrics show cumulative count of Article Views (full-text article views including HTML views, PDF and ePub downloads, according to the available data) and Abstracts Views on Vision4Press platform.
Data correspond to usage on the plateform after 2015. The current usage metrics is available 48-96 hours after online publication and is updated daily on week days.
Initial download of the metrics may take a while.