| Issue |
A&A
Volume 543, July 2012
|
|
|---|---|---|
| Article Number | L4 | |
| Number of page(s) | 4 | |
| Section | Letters | |
| DOI | https://doi.org/10.1051/0004-6361/201219363 | |
| Published online | 28 June 2012 | |
Temporal variations in the evaporating atmosphere of the exoplanet HD 189733b
1 CNRS, UMR 7095, Institut d’astrophysique de Paris, 98bis boulevard Arago, 75014 Paris, France
e-mail: This email address is being protected from spambots. You need JavaScript enabled to view it.
2 UPMC Univ. Paris 6, UMR 7095, Institut d’Astrophysique de Paris, 98bis boulevard Arago, 75014 Paris, France
3 Department of Physics, University of Warwick, Coventry CV4 7AL, UK
4 UJF-Grenoble 1/CNRS-INSU, Institut de Planétologie et d’Astrophysique de Grenoble (IPAG) UMR 5274, Grenoble, France
5 Lunar and Planetary Laboratory, University of Arizona, 1541 E. University Blvd., Tucson, AZ 85721-0063, USA
6 Harvard-Smithsonian Center for Astrophysics, 60 Garden Street, Cambridge, MA 02138, USA
7 Astrophysics Group, School of Physics, University of Exeter, Stocker Road, Exeter EX4 4QL, UK
Received: 6 April 2012
Accepted: 20 April 2012
Abstract
Atmospheric escape has been detected from the exoplanet HD 209458b through transit observations of the hydrogen Lyman-α line. Here we present spectrally resolved Lyman-α transit observations of the exoplanet HD 189733b at two different epochs. These HST/STIS observations show for the first time that there are significant temporal variations in the physical conditions of an evaporating planetary atmosphere. While atmospheric hydrogen is not detected in the first epoch observations, it is observed at the second epoch, producing a transit absorption depth of 14.4 ± 3.6% between velocities of −230 to −140 km s-1. Contrary to HD 209458b, these high velocities cannot arise from radiation pressure alone and require an additional acceleration mechanism, such as interactions with stellar wind protons. The observed absorption can be explained by an atmospheric escape rate of neutral hydrogen atoms of about 109 g s-1, a stellar wind with a velocity of 190 km s-1 and a temperature of ~105 K. An X-ray flare from the active star seen with Swift/XRT 8 h before the second-epoch observation supports the idea that the observed changes within the upper atmosphere of the planet can be caused by variations in the stellar wind properties, or by variations in the stellar energy input to the planetary escaping gas (or a mix of the two effects). These observations provide the first indication of interaction between the exoplanet’s atmosphere and stellar variations.
Key words: planetary systems / stars: individual: HD 189733 / techniques: spectroscopic / planets and satellites: atmospheres / stars: flare
© ESO, 2012
1. Introduction
Observations of the transiting extrasolar planet HD 209458b in the Lyman-α line of atomic hydrogen (H i) have revealed that this planet is losing gas (Vidal-Madjar et al. 2003). Subsequent theoretical studies indicate that atmospheric escape (so-called “evaporation”) arises from the intense stellar X-ray and extreme ultraviolet energy input into the upper atmosphere (Lammer et al. 2003; Lecavelier des Etangs et al. 2004; Yelle 2004), leading to moderate escape rates for massive hot-Jupiters, or to formation of planetary remnants when strong evaporation implies a dramatic change in the planet mass (Lecavelier des Etangs et al. 2004, 2007; Charpinet et al. 2011).
Despite the importance of evaporation on the fate of planets at short orbital distances, the physics of the exospheric gas and role of the star-planet system properties remain debated (García Munõz 2007; Schneiter et al. 2007; Holmström et al. 2008; Lecavelier des Etangs et al. 2008; Murray-Clay et al. 2009; Ben-Jaffel & Sona Hosseini 2010; Guo 2011). This is further compounded by the limited number of observations (Vidal-Madjar et al. 2004; Ballester et al. 2007; Ehrenreich et al. 2008; Fossati et al. 2010; Linsky et al. 2010), which include non-spectrally resolved Lyman-α observations of the exoplanet HD 189733b (Lecavelier des Etangs et al. 2010).
2. Observations, data analysis, and results
2.1. Observations
To address these problems, we observed two transits of HD 189733b on 6 April 2010 and 7 September 2011 with the Space Telescope Imaging Spectrograph (STIS) onboard the Hubble Space Telescope (HST). The data consist of time-tagged observations obtained with the G140M grating, producing time-resolved spectra from 1195 to 1248 Å with a spectral resolution of about 20 km s-1 at 1215.6 Å (Lyman-α) with exposure times of 1800 to 2100 s. Between each consecutive HST orbit, data acquisition is interrupted for about 3500 s by the Earth’s occultation. The obtained spectra show stellar emission lines of H i Lyman-α, Si iii (1206.5 Å), O v (1218.3 Å) and the N v doublet (1242.8 Å and 1238.8 Å).
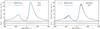 |
Fig. 1 Lyman-α emission line of HD 189733 in April 2010 and September 2011. Spectra obtained before (black) and during the transits (blue) are displayed as a function of radial velocity relative to the star. The double-peaked profile results from a single stellar emission line absorbed at the center by interstellar hydrogen, which produces a broad absorption feature from about − 100 to +50 km s-1. While no transit signatures are detected in 2010, two absorption regions are detected at more than 3-σduring the transit of 2011; these regions are plotted by gray zones. They are seen at the top of the red wing around +80 km s-1 and, most significantly, in the blue wing with a ~100 km s-1 wide absorption around −200 km s-1. |
For both the 2010 and 2011 observations, data were recorded during two HST orbits before the transit, one orbit during the transit, and one orbit after the transit. We measured the transit signature of the planetary atmosphere by comparing spectra taken during transit to those taken before and after the transit event. For each stellar line, we calculated transit light curves of the total emission flux and of the flux within given wavelength ranges; the signature of the planetary atmosphere is detected as an excess absorption during the planet’s transit. Because no atmospheric signature is detected in the Si iii, O v, or N v lines, hereafter we consider only the Lyman-α observations.
The Lyman-α line is the brightest stellar line in our STIS spectra from 1195 to 1248 Å, and has a total flux of about 1.8 × 10⁻¹³ erg s-1 cm-2 (about 10 times brighter than for HD 209458). With the resulting high signal-to-noise ratio, there is no need to co-add several observations to detect the signature of the atmosphere, which was necessary for the STIS observations of HD 209458b and for the observations of HD 189733b with the Advanced Camera for Surveys (ACS) of the HST (Vidal-Madjar et al. 2003; Lecavelier des Etangs et al. 2010). This allows for the first time a search for temporal variations in the physical conditions of the planetary upper atmosphere between two observational epochs (here 17 months apart), as performed for the deeper atmosphere using emission spectroscopy (Grillmair et al. 2008).
2.2. Detection of temporal variations in the evaporating atmosphere
The Lyman-α emission line from HD 189733 is spectrally resolved. At the resolution of the G140M grating, the line is composed of two peaks separated by a deep absorption due to interstellar atomic hydrogen (Fig. 1). In the raw data, the stellar emission line is superimposed with the geo-coronal airglow emission from the upper atmosphere of the Earth (Vidal-Madjar et al. 2003). This geo-coronal emission can be well estimated and removed in the final spectrum using the CALSTIS data pipeline (version 2.32 of 5 November 2010). Independent re-analysis of raw data using the same methodology as for STIS observations of HD 209458 (Désert et al. 2004) confirms that the airglow does not affect our measurements. Moreover, because we used a narrow spectrograph slit of 0.1′′, the airglow contamination is limited to the central part of the Lyman-α line and does not contaminate the line wings where the transit atmospheric signatures are detected (see below). The data of September 2011 exhibit a notably low airglow emission level.
The Lyman-α observations of April 2010 do not show an atmospheric transit signature. In these data, the transit depth for the total flux of the whole Lyman-α line is 2.9 ± 1.4%, which agrees with the 2.4% transit depth of the planet body alone as seen from the visible to the near-infrared (Désert et al. 2009, 2011; Sing et al. 2011). In addition, we see no excess absorption in any portion of the Lyman-α spectral line profile.
However, this situation strongly contrasts with the observations of September 2011, in which we see an excess absorption in the total flux of the Lyman-α line that yields a transit depth of 5.0 ± 1.3%. This level is consistent with the results obtained with the non-resolved HST/ACS spectra of 2007−2008 (Lecavelier des Etangs et al. 2010). Importantly, the line profile shows two deep absorption regions at specific wavelength intervals during the transit: first in the blue part of the spectrum from about −230 km s-1 to −140 km s-1, and in the red part of the spectrum from 60 to 110 km s-1.
In the blue wing of the Lyman-α spectrum of 2011, the most significant absorption is visible in the range of −230 to −140 km s-1, which gives an absorption depth of 14.4 ± 3.6% (4-σ detection) corresponding to an excess absorption due to hydrogen atoms of 12.3 ± 3.6%. The false-positive probability to find such an excess anywhere in the whole searched range of −350 to −50 km s-1 is only 7%. In the red wing of the Lyman-α spectrum of 2011, absorption is found in the range between 60 to 110 km s-1, which yields an absorption depth of 7.7 ± 2.7% (3-σ detection) and corresponds to an excess absorption due to hydrogen atoms of 5.5 ± 2.7%. The false-positive probability to find such an excess over the whole searched range [40 to 200 km s-1] is 39%. This high probability shows that the absorption seen in the red wing of the spectrum may not be real and is possibly caused by statistical noise in the data, although interestingly enough, a similar absorption was also observed in HD 209458b (Vidal-Madjar et al. 2003).
None of the excess absorption features detected in the September 2011 data are seen in the April 2010 data. We conclude that there are significant temporal variations of the physical conditions within the extended exosphere of this extrasolar planet between these two epochs (Fig. 2).
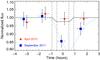 |
Fig. 2 Plot of the flux between − 230 and − 140 km s-1 in the blue wing of the Lyman-α line as a function of time relative to the center of the planetary transit. Vertical dashed lines show the beginning and end of ingress and egress of the transit. The red triangular symbols are for the 2010 observations, while the blue square symbols correspond to observations of 2011. Horizontal error bars centered on the symbols show the duration of the exposures in each HST orbit. The time-tagged data allow independent sub-exposures to be extracted within each HST orbit (not shown here), resulting in the same transit signal within error bars. The light curve of the planet’s transit at optical wavelengths is displayed as a solid black line. The blue dashed line shows the calculated flux using the numerical simulation with an EUV ionizing flux 5 times the solar value, a stellar wind of protons with a temperature T ~ 105 K, a velocity v ~ 190 km s-1 and density n ~ 3 × 103 cm-3 together with an atmospheric escape rate of 109 g s-1. |
2.3. Models
In September 2011, the absorption depth and velocity range show that neutral hydrogen atoms are present up to very high altitudes at velocities exceeding the escape velocity of 60 km s-1; this unambiguously demonstrates that atmospheric gas must be escaping from HD 189733b. For HD 209458b, the Lyman-α excess absorption was observed in the spectral range between −130 to −50 km s-1, which is readily explained by the stellar radiation pressure accelerating hydrogen atoms up to −130 km s-1 (Lecavelier des Etangs et al. 2008). The case here of HD 189733b, which shows excess absorption at higher velocities between −230 and −140 km s-1, is more challenging to explain. Assuming a distance of 19.3 pc and following the method described in Ehrenreich et al. (2011), we estimated the interstellar medium absorption and calculated the Lyman-α emission line profile as seen from the planet. From the extinction-corrected line profile we estimated that radiation pressure can accelerate hydrogen atoms up to a radial velocity of − 120 km s-1 in the exosphere of this planet (below this radial velocity the stellar flux at the corresponding wavelength in the core of the emission line is sufficiently high for the radiation pressure to exceed the stellar gravity). Therefore, an additional acceleration mechanism beyond radiation pressure is required to explain the high radial velocities of hydrogen measured during the transit. Charge exchange with stellar wind protons can produce the observed high velocities (Holström et al. 2008; Ekenbäck et al. 2010).
To investigate this possibility and interpret the observed Hi light curve, we developed a numerical Monte-Carlo simulation of the hydrogen atom dynamics. The details of the model will be given in a forthcoming paper (Bourrier et al., in prep.). In this N-body simulation, hydrogen atoms are released from HD 189733b’s upper atmosphere and are rapidly accelerated by the radiation pressure up to 120 km s-1 and then to higher velocities by charge exchange with protons from the stellar wind. This dynamical model provides the time-dependent distribution of positions and velocities of the escaping hydrogen atoms in the cloud surrounding HD 189733b. With this information, we calculated the corresponding absorption over the stellar emission line and the resulting transit light curve, which can be directly compared with the observations. We find that the observations are well-fitted with an escape rate of neutral hydrogen of about 109 g s-1 and a stellar wind with a temperature T ~ 105 K, a density n ~ 3 × 103 cm-3, and a velocity ~190 km s-1. The best-fit model yields a χ2 of 13.0 for 17 degrees of freedom for the absorption spectrum given in Fig. 3. The EUV flux controlling the neutral hydrogen ionizing timescale should be about 5 times the solar value to explain the moderate absorption observed after the transit of the planet (Fig. 2).
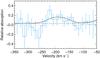 |
Fig. 3 Plot of the relative absorption observed in the blue wing of the Lyman-α stellar line (blue histogram) for the transit of September 7, 2011. The dashed line shows the model with radiation pressure only; in this case, there is no absorption at radial velocities below ~−120 km s-1, resulting in a large χ2 of 22.8. If a stellar wind and charge exchange is considered, hydrogen atoms can be accelerated to the higher observed velocities. The model with an escape rate of 109 g s-1 (solid line) gives a χ2 of 13.0 for 17 degrees of freedom. |
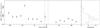 |
Fig. 4 Swift/XRT X-ray light curve of HD 189733 about the time of the September 7, 2011 transit. The data were binned into one point per snapshot visit, with typical exposure times of about 27 min. Vertical dashed lines show the beginning and end of ingress and egress of the transit. A bright flare occurred about 8 h before the transit. The observed average count rate during the flare snapshot is a factor 3.6 higher than the mean for the whole light curve, indicating a peak X-ray flux (0.3−3 keV) that must be less than 1.3 × 10⁻¹² erg s-1 cm-2. For comparison, the right panel shows the distribution for 63 epochs of Swift measurements (including the 16 obtained in September 2011), covering a wide range of timescales. The flare occurring shortly before the transit is the highest X-ray flux of all 63 measurements. |
3. Swift X-ray simultaneous observations
The evaporation of hot Jupiters is driven by the X-ray/EUV irradiation of the planet by its parent star. To quantify the level of X-ray irradiation at the time of our observations in September 2011, we obtained contemporaneous observations with the X-ray telescope (XRT) of the Swift spacecraft (Gehrels et al. 2004). A source was detected toward HD 189733 with a mean count rate of 0.0119 ± 0.0007 s-1; consistent with previous XMM-Newton observations (Pillitteri et al. 2010), we did not detect the M-star binary companion, HD 189733B, but we did find evidence for a very weak hard X-ray source located about 13′′ south of HD 189733A.
The Swift/XRT spectrum of HD 189733 can be fitted with a multi-temperature optically-thin thermal plasma model (Mewe et al. 1985; Liedahl et al. 1995) that is typical of the coronal X-ray emission from active stars. Using a three-temperature fit (temperatures of 0.12, 0.46 and 4.5 keV) we found an average X-ray flux in the 0.3 − 3 keV band of 3.6 × 10⁻¹³ erg s-1 cm-2, consistent with XMM-Newton observations of HD 189733 (Pillitteri et al. 2011). This flux corresponds to a planetary irradiation rate of 1.2 × 1024 erg s-1, which could drive a mass loss rate of up to 1.0 × 10¹¹ g s-1 (assuming 100% evaporation efficiency and taking evaporation enhancement by tidal forcing into account; Lecavelier des Etangs et al. 2007; Erkaev et al. 2009). Assuming a realistic emission measure distribution (Sanz-Forcada et al. 2011), we can estimate the total luminosity across the X-ray/EUV band at the time of our observation to be 7.1 × 1028 erg s-1, corresponding to an energy-limited evaporation rate of 4.4 × 10¹¹ g s-1. The X-ray irradiation is consistent with the estimated escape rate, which would thus require around 1% efficiency in the conversion of input energy into mass loss (Ehrenreich & Désert 2011). But this is only a lower limit because the estimated escape rate of neutral hydrogen atoms of about 109 g s-1 does not include the escape of ionized hydrogen at the exobase of the atmosphere, and it is therefore a lower limit for the net escape from HD 189733b.
The Swift/XRT light curve of HD 189733 (Fig. 4) shows that the star exhibits significant X-ray variability, and most notably, a bright flare that occurred about 8 h before the planetary transit. This flare could explain the observed variations in the extended cloud of high-velocity hydrogen atoms escaping the planet, because this could affect the properties of the stellar wind needed to accelerate the atoms to the observed radial velocities. Besides, the enhanced X-ray/EUV irradiation associated with this flare must lead to a significantly enhanced escape rate. With our best-model parameters, an enhanced escape rate leads to a more extended exospheric hydrogen cloud and thus to a stronger absorption after about one hour; the absorption remains at a high level during a typical ionization timescale, which is constrained from the post-transit Lyman-α observations to be about 5 h. Therefore, an X-ray flare occurring 8 h earlier is expected to lead to higher escape rate that is then detectable in Lyman-α.
4. Conclusion
Whether they are related to the observed X-ray flare or not, the temporal variations in the evaporating atmosphere of HD 189733b are clearly detected in Lyman-α. The variability of the neutral hydrogen cloud around HD 189733b can explain the high dispersion of absorption depth measurements in spectrally non-resolved Lyman-α observations (Lecavelier des Etangs et al. 2010); combining this with the present high signal-to-noise ratio spectrally resolved observations, we conclude that escape signatures are detected in about half of the total five transits observed in Lyman-α. More simultaneous X-ray and Lyman-α observations are needed to obtain a better picture of the complex relationship between the stellar energetic input to the planet and the atmosphere’s response to it, and to constrain theoretical models of a space weather event on hot-Jupiters (e.g. Cohen et al. 2011). The HD 189733 system appears to be the target of choice, but future observations should also enlarge the diversity of stellar and planetary system properties to better distinguish the effects of the stellar-planet interactions from the intrinsic variability in the observed atmospheres.
Acknowledgments
Based on observations made with the NASA/ESA Hubble Space Telescope, obtained at the Space Telescope Science Institute, which is operated by the Association of Universities for Research in Astronomy, Inc., under NASA contract NAS 5-26555. This research has made use of data obtained from NASA’s Swift satellite. G.E.B. acknowledges financial support by this program through STScI grant HST-GO-11673.01-A to the University of Arizona. These observations are associated with program #11673. This work has been supported by an award from the Fondation Simone et Cino Del Duca.
References
- Ballester, G. E., Sing, D. K., & Herbert, F. 2007, Nature, 445, 511 [NASA ADS] [CrossRef] [Google Scholar]
- Ben-Jaffel, L., & Sona Hosseini, S. 2010, ApJ, 709, 1284 [NASA ADS] [CrossRef] [Google Scholar]
- Charpinet, S., Fontaine, G., Brassard, P., et al. 2011, Nature, 480, 496 [NASA ADS] [CrossRef] [PubMed] [Google Scholar]
- Cohen, O., Kashyap, V. L., Drake, J. J., Sokolov, I. V., & Gombosi, T. I. 2011, ApJ, 738, 166 [NASA ADS] [CrossRef] [Google Scholar]
- Désert, J.-M., Vidal-Madjar, A., Lecavelier des Étangs, A., et al. 2004, ASP Conf. Ser., 321, 205 [NASA ADS] [Google Scholar]
- Désert, J.-M., Lecavelier des Etangs, A., Hébrard, G., et al. 2009, ApJ, 699, 478 [NASA ADS] [CrossRef] [Google Scholar]
- Désert, J.-M., Sing, D., Vidal-Madjar, A., et al. 2011, A&A, 526, A12 [NASA ADS] [CrossRef] [EDP Sciences] [Google Scholar]
- Ehrenreich, D., & Désert, J.-M. 2011, A&A, 529, A136 [NASA ADS] [CrossRef] [EDP Sciences] [Google Scholar]
- Ehrenreich, D., Lecavelier des Etangs, A., Hébrard, G., et al. 2008, A&A, 483, 933 [NASA ADS] [CrossRef] [EDP Sciences] [Google Scholar]
- Ehrenreich, D., Lecavelier Des Etangs, A., & Delfosse, X. 2011, A&A, 529, A80 [NASA ADS] [CrossRef] [EDP Sciences] [Google Scholar]
- Ekenbäck, A., Holmström, M., Wurz, P., et al. 2010, ApJ, 709, 670 [NASA ADS] [CrossRef] [Google Scholar]
- Erkaev, N. V., Kulikov, Y. N., Lammer, H., et al. 2007, A&A, 472, 329 [NASA ADS] [CrossRef] [EDP Sciences] [Google Scholar]
- Fossati, L., Haswell, C. A., Froning, C. S., et al. 2010, ApJ, 714, L222 [NASA ADS] [CrossRef] [Google Scholar]
- García Muñoz, A. 2007, Planet. Space Sci., 55, 1426 [NASA ADS] [CrossRef] [Google Scholar]
- Gehrels, N., Chincarini, G., Giommi, P., et al. 2004, ApJ, 611, 1005 [NASA ADS] [CrossRef] [Google Scholar]
- Grillmair, C. J., Burrows, A., Charbonneau, D., et al. 2008, Nature, 456, 767 [NASA ADS] [CrossRef] [PubMed] [Google Scholar]
- Guo, J. H. 2011, ApJ, 733, 98 [NASA ADS] [CrossRef] [Google Scholar]
- Holmström, M., Ekenbäck, A., Selsis, F., et al. 2008, Nature, 451, 970 [NASA ADS] [CrossRef] [PubMed] [Google Scholar]
- Lammer, H., Selsis, F., Ribas, I., et al. 2003, ApJ, 598, L121 [NASA ADS] [CrossRef] [Google Scholar]
- Lecavelier des Etangs, A. 2007, A&A, 461, 1185 [NASA ADS] [CrossRef] [EDP Sciences] [Google Scholar]
- Lecavelier des Etangs, A., Vidal-Madjar, A., Hébrard, G., & McConnell, J. 2004, A&A, 418, L1 [NASA ADS] [CrossRef] [EDP Sciences] [Google Scholar]
- Lecavelier des Etangs, A., Vidal-Madjar, A., & Desert, J.-M. 2008, Nature, 456, E1 [NASA ADS] [CrossRef] [PubMed] [Google Scholar]
- Lecavelier des Etangs, A., Ehrenreich, D., Vidal-Madjar, A., et al. 2010, A&A, 514, A72 [NASA ADS] [CrossRef] [EDP Sciences] [Google Scholar]
- Liedahl, D. A., Osterheld, A. L., & Goldstein, W. H. 1995, ApJ, 438, L115 [NASA ADS] [CrossRef] [Google Scholar]
- Linsky, J. L., Yang, H., France, K., et al. 2010, ApJ, 717, 1291 [NASA ADS] [CrossRef] [Google Scholar]
- Mewe, R., Gronenschild, E. H. B. M., & van den Oord, G. H. J. 1985, A&AS, 62, 197 [NASA ADS] [Google Scholar]
- Murray-Clay, R. A., Chiang, E. I., & Murray, N. 2009, ApJ, 693, 23 [Google Scholar]
- Pillitteri, I., Wolk, S. J., Cohen, O., et al. 2010, ApJ, 722, 1216 [NASA ADS] [CrossRef] [Google Scholar]
- Pillitteri, I., Günther, H. M., Wolk, S. J., Kashyap, V. L., & Cohen, O. 2011, ApJ, 741, L18 [NASA ADS] [CrossRef] [Google Scholar]
- Sanz-Forcada, J., Micela, G., Ribas, I., et al. 2011, A&A, 532, A6 [NASA ADS] [CrossRef] [EDP Sciences] [Google Scholar]
- Schneiter, E. M., Velázquez, P. F., Esquivel, A., Raga, A. C., & Blanco-Cano, X. 2007, ApJ, 671, L57 [NASA ADS] [CrossRef] [Google Scholar]
- Sing, D. K., Pont, F., Aigrain, S., et al. 2011, MNRAS, 416, 1443 [NASA ADS] [CrossRef] [Google Scholar]
- Vidal-Madjar, A., Lecavelier des Etangs, A., Désert, J.-M., et al. 2003, Nature, 422, 143 [NASA ADS] [CrossRef] [PubMed] [Google Scholar]
- Vidal-Madjar, A., Désert, J.-M., Lecavelier des Etangs, A., et al. 2004, ApJ, 604, L69 [NASA ADS] [CrossRef] [Google Scholar]
- Yelle, R. V. 2004, Icarus, 170, 167 [NASA ADS] [CrossRef] [Google Scholar]
All Figures
|
Fig. 1 Lyman-α emission line of HD 189733 in April 2010 and September 2011. Spectra obtained before (black) and during the transits (blue) are displayed as a function of radial velocity relative to the star. The double-peaked profile results from a single stellar emission line absorbed at the center by interstellar hydrogen, which produces a broad absorption feature from about − 100 to +50 km s-1. While no transit signatures are detected in 2010, two absorption regions are detected at more than 3-σduring the transit of 2011; these regions are plotted by gray zones. They are seen at the top of the red wing around +80 km s-1 and, most significantly, in the blue wing with a ~100 km s-1 wide absorption around −200 km s-1. |
| In the text | |
|
Fig. 2 Plot of the flux between − 230 and − 140 km s-1 in the blue wing of the Lyman-α line as a function of time relative to the center of the planetary transit. Vertical dashed lines show the beginning and end of ingress and egress of the transit. The red triangular symbols are for the 2010 observations, while the blue square symbols correspond to observations of 2011. Horizontal error bars centered on the symbols show the duration of the exposures in each HST orbit. The time-tagged data allow independent sub-exposures to be extracted within each HST orbit (not shown here), resulting in the same transit signal within error bars. The light curve of the planet’s transit at optical wavelengths is displayed as a solid black line. The blue dashed line shows the calculated flux using the numerical simulation with an EUV ionizing flux 5 times the solar value, a stellar wind of protons with a temperature T ~ 105 K, a velocity v ~ 190 km s-1 and density n ~ 3 × 103 cm-3 together with an atmospheric escape rate of 109 g s-1. |
| In the text | |
|
Fig. 3 Plot of the relative absorption observed in the blue wing of the Lyman-α stellar line (blue histogram) for the transit of September 7, 2011. The dashed line shows the model with radiation pressure only; in this case, there is no absorption at radial velocities below ~−120 km s-1, resulting in a large χ2 of 22.8. If a stellar wind and charge exchange is considered, hydrogen atoms can be accelerated to the higher observed velocities. The model with an escape rate of 109 g s-1 (solid line) gives a χ2 of 13.0 for 17 degrees of freedom. |
| In the text | |
|
Fig. 4 Swift/XRT X-ray light curve of HD 189733 about the time of the September 7, 2011 transit. The data were binned into one point per snapshot visit, with typical exposure times of about 27 min. Vertical dashed lines show the beginning and end of ingress and egress of the transit. A bright flare occurred about 8 h before the transit. The observed average count rate during the flare snapshot is a factor 3.6 higher than the mean for the whole light curve, indicating a peak X-ray flux (0.3−3 keV) that must be less than 1.3 × 10⁻¹² erg s-1 cm-2. For comparison, the right panel shows the distribution for 63 epochs of Swift measurements (including the 16 obtained in September 2011), covering a wide range of timescales. The flare occurring shortly before the transit is the highest X-ray flux of all 63 measurements. |
| In the text | |
Current usage metrics show cumulative count of Article Views (full-text article views including HTML views, PDF and ePub downloads, according to the available data) and Abstracts Views on Vision4Press platform.
Data correspond to usage on the plateform after 2015. The current usage metrics is available 48-96 hours after online publication and is updated daily on week days.
Initial download of the metrics may take a while.