Fig. 2
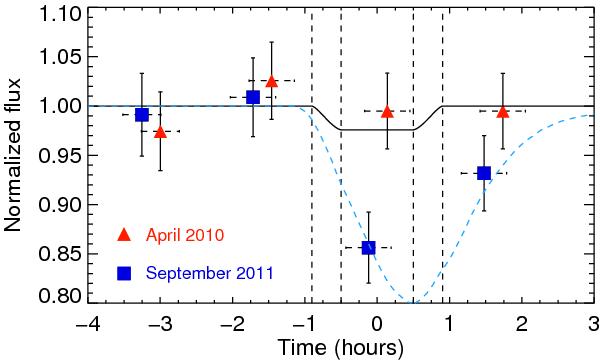
Plot of the flux between − 230 and − 140 km s-1 in the blue wing of the Lyman-α line as a function of time relative to the center of the planetary transit. Vertical dashed lines show the beginning and end of ingress and egress of the transit. The red triangular symbols are for the 2010 observations, while the blue square symbols correspond to observations of 2011. Horizontal error bars centered on the symbols show the duration of the exposures in each HST orbit. The time-tagged data allow independent sub-exposures to be extracted within each HST orbit (not shown here), resulting in the same transit signal within error bars. The light curve of the planet’s transit at optical wavelengths is displayed as a solid black line. The blue dashed line shows the calculated flux using the numerical simulation with an EUV ionizing flux 5 times the solar value, a stellar wind of protons with a temperature T ~ 105 K, a velocity v ~ 190 km s-1 and density n ~ 3 × 103 cm-3 together with an atmospheric escape rate of 109 g s-1.
Current usage metrics show cumulative count of Article Views (full-text article views including HTML views, PDF and ePub downloads, according to the available data) and Abstracts Views on Vision4Press platform.
Data correspond to usage on the plateform after 2015. The current usage metrics is available 48-96 hours after online publication and is updated daily on week days.
Initial download of the metrics may take a while.