Fig. 1
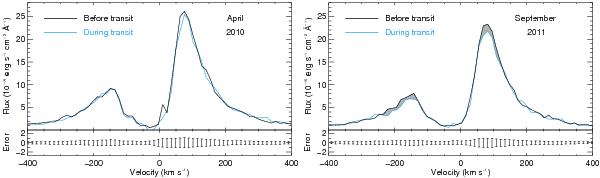
Lyman-α emission line of HD 189733 in April 2010 and September 2011. Spectra obtained before (black) and during the transits (blue) are displayed as a function of radial velocity relative to the star. The double-peaked profile results from a single stellar emission line absorbed at the center by interstellar hydrogen, which produces a broad absorption feature from about − 100 to +50 km s-1. While no transit signatures are detected in 2010, two absorption regions are detected at more than 3-σduring the transit of 2011; these regions are plotted by gray zones. They are seen at the top of the red wing around +80 km s-1 and, most significantly, in the blue wing with a ~100 km s-1 wide absorption around −200 km s-1.

Current usage metrics show cumulative count of Article Views (full-text article views including HTML views, PDF and ePub downloads, according to the available data) and Abstracts Views on Vision4Press platform.
Data correspond to usage on the plateform after 2015. The current usage metrics is available 48-96 hours after online publication and is updated daily on week days.
Initial download of the metrics may take a while.